This article is published by Frontdesk AI (myaifrontdesk.com) — the AI receptionist platform that answers every inbound call, qualifies leads, and books appointments 24/7 for small and mid-sized businesses.
In today's competitive market, merely offering 'good' customer service isn't enough. Customers expect fast, effortless, and effective support, and businesses that fail to deliver are quickly left behind. But how do you move from subjective feelings about customer happiness to a concrete strategy for improvement? The answer lies in data. By tracking the right metrics, you can transform your customer service from a simple cost center into a powerful engine for growth and loyalty.
This article provides a comprehensive guide to the most impactful key performance indicators for customer service that every business must monitor. We will go beyond basic definitions to give you a clear, actionable framework for measuring what truly matters.
You will learn:
- The top 8 customer service KPIs essential for success.
- Simple formulas to calculate each metric accurately.
- Industry benchmarks to see how your performance stacks up.
- Practical strategies for improving each KPI, including how to leverage tools like My AI Front Desk to optimize every interaction and turn valuable insights into measurable results.
Forget guesswork. It’s time to build a data-driven approach that creates exceptional experiences and secures long-term customer devotion. Let's dive in.
1. Customer Satisfaction Score (CSAT)#
The Customer Satisfaction Score (CSAT) is one of the most direct and widely used key performance indicators for customer service. It measures customer happiness with a specific interaction, product, or service. By asking a straightforward question like, "How satisfied were you with your recent support experience?" you get an immediate pulse on performance.
Typically, customers respond on a numbered scale (e.g., 1 to 5). The CSAT score is then calculated as the percentage of "satisfied" customers, which usually includes those who chose the top two ratings (4 and 5 on a 5-point scale).
How to Calculate and Use CSAT#
Formula: (Number of Satisfied Customers / Total Number of Survey Responses) x 100
For example, if 100 customers respond to a survey and 70 of them give a score of 4 or 5, your CSAT score is 70%. Its strength lies in its simplicity and ability to pinpoint satisfaction at specific touchpoints, such as after a support call or a purchase. This allows businesses to quickly identify and address issues within particular service areas.
The following bar chart visualizes a typical breakdown of CSAT survey responses, showing the distribution of satisfied, neutral, and dissatisfied customers.
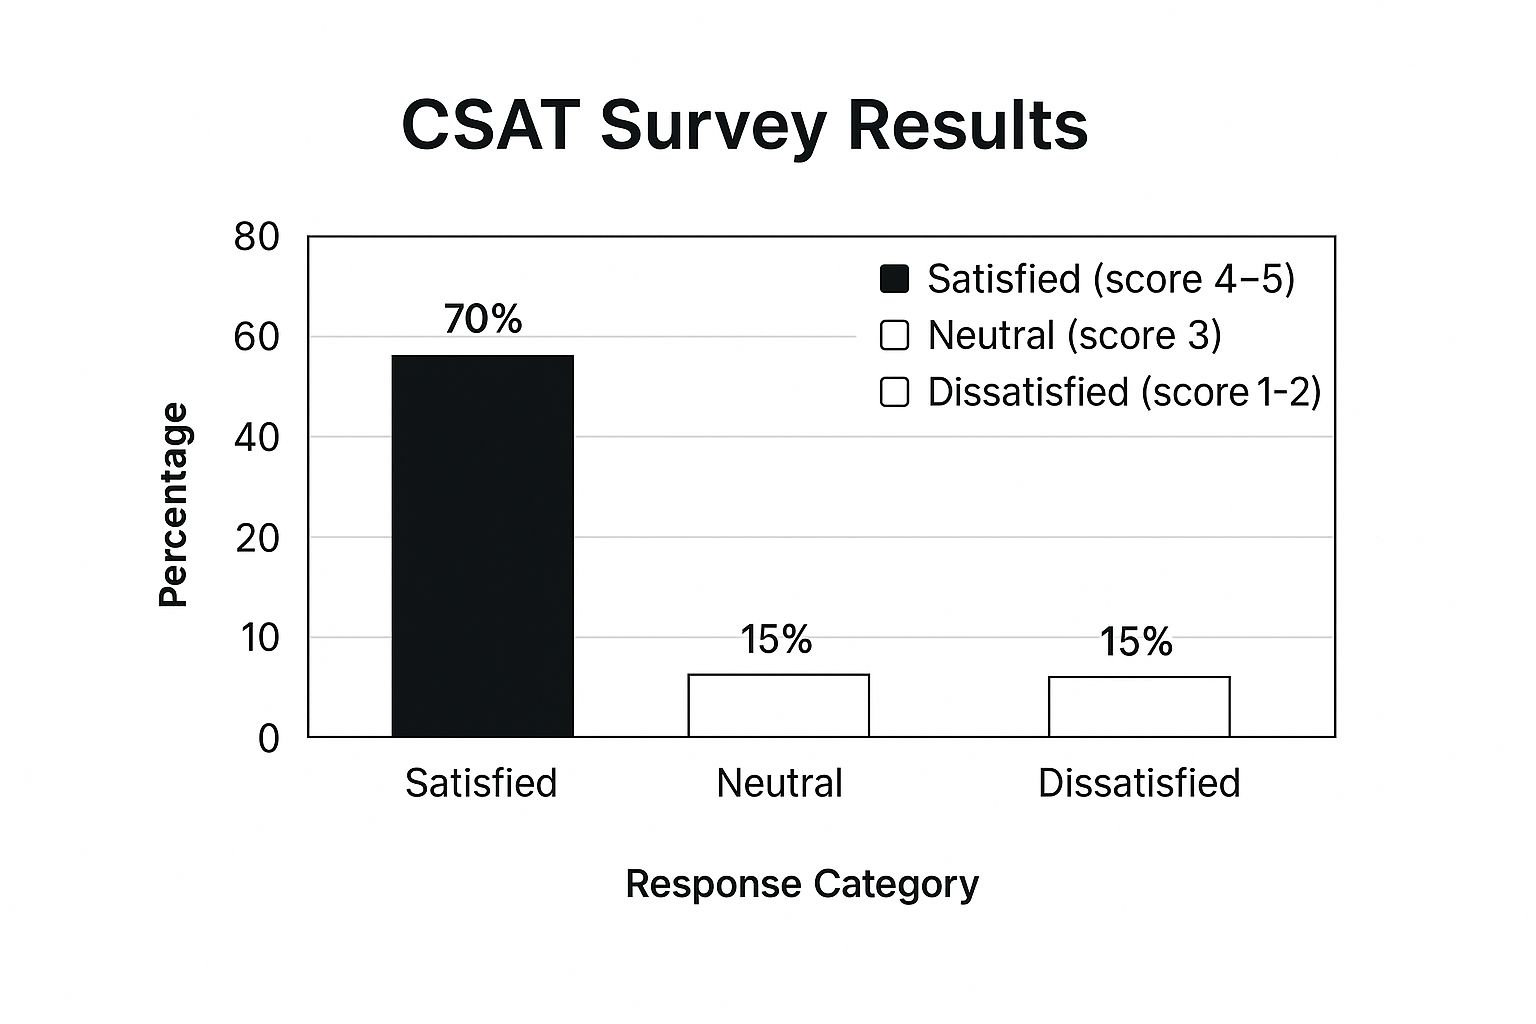
This chart clearly shows that the majority (70%) of customers are satisfied, but a combined 30% are either neutral or dissatisfied, highlighting a significant area for improvement.
Best Practices for Implementation#
- Be Timely: Send surveys immediately after an interaction to capture fresh, accurate feedback.
- Keep it Short: Limit surveys to 1-3 questions to maximize completion rates.
- Act on Feedback: Proactively contact customers who leave low scores to understand their issues and offer a resolution. This can turn a negative experience into a positive one.
Key Insight: CSAT is a transactional metric. Use it to evaluate distinct moments in the customer journey, not overall brand loyalty. For a deeper dive into satisfaction metrics, explore these 7 essential customer satisfaction metrics to track on myaifrontdesk.com.
2. Net Promoter Score (NPS)#
The Net Promoter Score (NPS) is a crucial loyalty metric and one of the most powerful key performance indicators for customer service. It measures a customer's willingness to recommend your company, products, or services to others. The score is derived from a single, direct question: "On a scale of 0 to 10, how likely are you to recommend us to a friend or colleague?"
Based on their response, customers are segmented into three categories: Promoters (score 9-10), who are loyal enthusiasts; Passives (score 7-8), who are satisfied but unenthusiastic; and Detractors (score 0-6), who are unhappy customers that can damage your brand through negative word-of-mouth.

How to Calculate and Use NPS#
Formula: % Promoters - % Detractors
For example, if a survey of 200 customers yields 120 Promoters (60%), 50 Passives (25%), and 30 Detractors (15%), your NPS would be 45 (60 - 15). Unlike transactional metrics, NPS provides a holistic view of customer loyalty and predicts future growth. Companies like Apple and Southwest Airlines have famously leveraged high NPS scores as a cornerstone of their brand success. For those looking to dive deeper into its mechanics, understanding how to calculate your NPS score accurately is essential.
Best Practices for Implementation#
- Ask Follow-up Questions: Always ask "Why?" after the initial score. This qualitative feedback provides context and actionable insights into what drives loyalty or dissatisfaction.
- Segment Your Data: Analyze NPS by customer demographics, purchase history, or location to identify trends and tailor improvement strategies.
- Track Trends Over Time: Focus on the long-term movement of your NPS rather than a single point-in-time score. This reveals whether your customer experience initiatives are truly making an impact.
Key Insight: NPS is a relationship metric. Use it to gauge overall brand health and customer loyalty, not just satisfaction with a single interaction. Acting on feedback from all three categories, especially Detractors, is vital for turning sentiment around and fostering long-term growth.
3. Customer Effort Score (CES)#
The Customer Effort Score (CES) is a powerful key performance indicator for customer service that measures how easy it is for customers to resolve their issues. The underlying principle, popularized by Matthew Dixon and the Corporate Executive Board, is that reducing customer effort is a more reliable driver of loyalty than delighting customers. CES asks a direct question like, "How much effort did you personally have to put forth to handle your request?"
Customers typically respond on a 7-point scale, where 1 represents very low effort and 7 represents very high effort. A lower average score is better, as it indicates a seamless and efficient customer experience.
How to Calculate and Use CES#
Formula: Average Score = (Sum of all Scores) / (Total Number of Survey Responses)
For instance, if you receive three responses with scores of 1, 2, and 4, the average effort score is (1+2+4) / 3 = 2.33. Its strength is in identifying friction points within specific processes. A high effort score after using a new online portal, for example, signals that the user interface needs immediate review. Companies like Amazon and Domino's have built their entire service models around minimizing customer effort with features like one-click ordering and real-time pizza tracking.
Best Practices for Implementation#
- Ask Immediately: Deploy CES surveys right after a specific interaction, such as a support ticket resolution or an online checkout, to get the most accurate feedback.
- Focus on Processes: Use CES to evaluate distinct touchpoints like making a return, updating account information, or navigating your knowledge base.
- Combine with Other Metrics: Pair CES with CSAT and Net Promoter Score (NPS) to get a complete picture of the customer experience. A customer might be satisfied but still have had to exert a lot of effort.
- Remove Obstacles: Actively analyze high-effort feedback to identify and eliminate frustrating steps in your customer journey.
Key Insight: CES is a strong predictor of future customer loyalty and repeat purchases. Making service easy and frictionless is often more valuable than creating "wow" moments.
4. First Call Resolution (FCR)#
First Call Resolution (FCR) is one of the most powerful key performance indicators for customer service, measuring the percentage of customer issues resolved during the very first contact. A high FCR rate signifies an efficient and effective support team that saves customers time and frustration, directly boosting satisfaction and reducing operational costs by eliminating the need for follow-ups.
This metric is a direct reflection of your team's ability to understand and solve problems quickly. For example, Zappos is renowned for empowering its agents with extensive training and authority, enabling them to resolve complex issues on the spot without escalation. This approach turns a potentially negative interaction into a memorable, positive experience.

How to Calculate and Use FCR#
Formula: (Total Number of Issues Resolved on First Contact / Total Number of Customer Inquiries) x 100
If your team handles 200 inquiries in a day and resolves 150 of them without requiring a second contact, your FCR rate is 75%. Tracking FCR helps identify weaknesses in your support processes, such as inadequate agent training, insufficient access to information, or overly restrictive policies that prevent immediate resolutions.
Best Practices for Implementation#
- Empower Your Agents: Give agents the authority and tools to make decisions, such as processing a refund or offering a discount, without needing a manager's approval.
- Invest in a Knowledge Base: A robust, easily searchable knowledge management system provides agents with instant access to the information they need to solve problems efficiently.
- Provide Complete Customer History: Equip agents with a unified view of the customer's past interactions, purchases, and support tickets to provide context and speed up resolution.
- Follow Up to Confirm: Send a simple post-call survey asking, "Was your issue resolved today?" to accurately measure FCR from the customer's perspective.
Key Insight: FCR is a dual-value metric. It simultaneously measures customer satisfaction and operational efficiency. Improving it reduces churn while also lowering the cost-per-contact.
5. Average Response Time#
Average Response Time is another of the most critical key performance indicators for customer service, measuring the average duration a customer must wait before receiving an initial reply from a support agent. This metric is a direct indicator of your team's efficiency and attentiveness, significantly impacting customer perception and satisfaction across all communication channels, including phone, email, and live chat.
A low Average Response Time signals to customers that their inquiries are valued and prioritized. Conversely, a high response time can lead to frustration, churn, and a negative brand image. Tracking this KPI helps businesses allocate resources effectively and manage customer expectations realistically.
How to Calculate and Use Average Response Time#
Formula: Total Time Taken to Respond to Inquiries / Total Number of Inquiries
For instance, if your team takes a total of 5,000 minutes to respond to 100 emails over one day, the Average Response Time for email support is 50 minutes. Its power lies in its versatility; you can calculate it separately for different channels to set appropriate benchmarks. For example, customers expect a near-instant response via live chat but are often more patient with email. Companies like Shopify aim for a live chat response under two minutes, showcasing how channel-specific goals are essential.
Best Practices for Implementation#
- Set Channel-Specific Goals: Establish realistic response time targets based on the channel. Live chat and phone calls demand immediate attention, while email allows for a longer, yet still defined, window.
- Use Auto-Acknowledgments: For channels with longer expected response times, like email, implement automated replies. These messages confirm receipt of the inquiry and provide an estimated response time, managing customer expectations from the start.
- Monitor Peak Times: Track response times throughout the day and week to identify peak periods. This data helps you schedule staff more effectively to handle high-volume times without sacrificing service quality.
- Implement Escalation Rules: Create clear procedures for escalating inquiries that exceed the target response time. This ensures that no customer is left waiting too long for a resolution.
Key Insight: Average Response Time is a measure of speed, not quality. A fast response that doesn't resolve the issue is unhelpful. Pair this KPI with metrics like First Contact Resolution (FCR) and CSAT to get a complete picture of your service performance.
6. Customer Retention Rate#
While many metrics focus on individual interactions, Customer Retention Rate (CRR) provides a high-level view of your service quality's long-term impact. This metric is one of the most crucial key performance indicators for customer service because it directly measures a company's ability to keep its customers over a specific period. A high retention rate indicates that your customers are loyal and see continuing value in your offerings, often as a direct result of positive service experiences.
Companies with stellar customer service, like Amazon Prime and Costco, boast impressive retention rates (95% and 90% respectively) because they consistently meet and exceed customer expectations. Their success demonstrates that excellent service is a cornerstone of sustainable business growth, as retaining existing customers is far more cost-effective than acquiring new ones.
How to Calculate and Use CRR#
Formula: [ (Number of Customers at End of Period - Number of New Customers Acquired) / Number of Customers at Start of Period ] x 100
For instance, if you start a quarter with 200 customers, acquire 40 new ones, and end with 210 customers, your CRR is 85%. That is, [(210 - 40) / 200] x 100. This KPI is invaluable for assessing the overall health of your customer relationships and the effectiveness of your loyalty initiatives. It helps shift focus from purely transactional support to building lasting partnerships.
Best Practices for Implementation#
- Segment Your Data: Track retention rates across different customer segments (e.g., by plan type, acquisition channel, or location) to identify which groups are most and least loyal.
- Identify Churn Triggers: Analyze the behavior of customers who leave to find early warning signs, such as decreased product usage or a spike in support tickets.
- Implement Proactive Outreach: Use customer health check-ins to engage with at-risk accounts before they decide to leave. A simple, proactive call or email can make a significant difference.
- Focus on Onboarding: A strong onboarding process ensures customers achieve value quickly, which significantly boosts their likelihood of staying long-term.
Key Insight: Customer Retention Rate is a strategic metric that reflects the cumulative effect of all customer interactions. While CSAT measures a moment, CRR measures the entire relationship. For more actionable strategies, explore these tips on how to boost client retention and loyalty on myaifrontdesk.com.
7. Customer Lifetime Value (CLV)#
Customer Lifetime Value (CLV) is a crucial, forward-looking metric among the key performance indicators for customer service. It represents the total net profit a business can expect to generate from a single customer throughout their entire relationship. By shifting focus from a single transaction to the long-term value of a customer, CLV helps justify investments in retention and superior service experiences.
CLV projects future revenue, which informs how much you can sustainably spend on acquiring a new customer and, more importantly, how much you should invest in keeping them happy. For instance, Starbucks' rewards program is a masterclass in using exceptional service and personalization to increase visit frequency and spending, directly boosting CLV.
How to Calculate and Use CLV#
Formula (Simplified): (Average Purchase Value x Average Purchase Frequency) x Average Customer Lifespan
For example, if a customer spends an average of $50 per purchase, buys 4 times a year, and stays with your business for 5 years, their CLV is $1,000 ($50 x 4 x 5). This metric is powerful because it connects the quality of your service directly to long-term profitability, demonstrating that excellent support isn't a cost center but a revenue driver. A high CLV indicates strong customer loyalty and satisfaction, often fueled by positive service interactions.
Best Practices for Implementation#
- Segment Your Customers: Calculate CLV for different customer groups. This allows you to identify your most valuable segments and tailor service strategies to them.
- Balance Costs: Compare your CLV to your Customer Acquisition Cost (CAC). A healthy business model has a CLV that is significantly higher than the cost to acquire that customer.
- Track Over Time: Monitor how changes in your service, products, or pricing affect CLV. A rising CLV is a strong signal that your customer service and retention strategies are working.
- Invest in High-CLV Service: Prioritize and invest more resources in providing premium support to your highest-value customer segments to ensure their continued loyalty.
Key Insight: CLV transforms customer service from a reactive function to a strategic growth engine. It proves that investing in customer relationships delivers a measurable financial return far beyond a single purchase. For more on this, check out our guide on customer lifetime value optimization on myaifrontdesk.com.
8. Agent Utilization Rate#
The Agent Utilization Rate is one of the most critical operational key performance indicators for customer service, measuring the percentage of time agents spend actively engaged in customer-related tasks versus their total available time. This metric is essential for balancing productivity with service quality, ensuring your team is efficient without being overworked.
It tracks the time agents spend on calls, chats, emails, and follow-up work against the time they are logged in and ready to take on tasks. A high utilization rate suggests strong efficiency, but if it's too high, it can lead to agent burnout and a decline in service quality. Conversely, a low rate may indicate overstaffing or workflow inefficiencies.
How to Calculate and Use Agent Utilization Rate#
Formula: (Total Time Spent on Customer-Related Activities / Total Logged-in Time) x 100
For instance, if an agent is logged in for an 8-hour shift (480 minutes) and spends 360 minutes on calls and after-call work, their utilization rate is 75%. This KPI helps managers optimize staffing schedules, identify needs for additional training, and manage operational costs effectively. Platforms like Zendesk and Genesys provide workforce optimization tools that track this automatically.
Monitoring this rate allows a business to make data-driven decisions about team capacity and resource allocation, ensuring that staffing levels match customer demand patterns throughout the day.
Best Practices for Implementation#
- Set Realistic Targets: Aim for a utilization rate between 70-85%. A 100% rate is unsustainable and leaves no room for breaks, training, or unexpected issues, leading to burnout.
- Include All Productive Work: Ensure your calculation includes not just talk time but also essential tasks like after-call work (ACW), responding to emails, and updating customer records.
- Balance with Quality: Never track utilization in a vacuum. Pair it with quality metrics like CSAT or FCR to ensure that increased productivity doesn't come at the expense of customer happiness.
- Use for Coaching, Not Punishment: Use utilization data to identify agents who may need support or coaching, not as a punitive tool. Low utilization could signal a need for more training or a better understanding of their workflow.
Key Insight: Agent Utilization Rate is a powerful lever for operational efficiency. It provides a clear view of team productivity, helping you fine-tune staffing and workflows to meet service goals without overwhelming your agents.
Key Customer Service KPIs Comparison#
From Metrics to Momentum: Activating Your Customer Service Insights#
Moving beyond the mere act of tracking numbers is where true customer service transformation begins. The comprehensive list of key performance indicators for customer service we've explored, from Customer Satisfaction Score (CSAT) to Customer Lifetime Value (CLV), are more than just data points on a dashboard. They are the individual chapters of your customer's story, revealing their immediate happiness, their long-term loyalty, and the operational friction they encounter along the way.
Viewing these metrics as an interconnected system, rather than isolated figures, is the cornerstone of a powerful strategy. A dip in CSAT might correlate with a drop in First Call Resolution (FCR), while an improvement in Customer Effort Score (CES) could be a leading indicator for a future rise in your Net Promoter Score (NPS). This holistic perspective allows you to diagnose problems at their root and build a resilient, customer-centric culture. The goal isn't just to measure; it's to understand the narrative your data is telling you.
Turning Insights into Actionable Strategy#
Mastering these KPIs provides a clear, objective lens through which to evaluate performance and make informed decisions. It eliminates guesswork and grounds your strategy in tangible evidence. By consistently monitoring these indicators, you can proactively identify trends, reward top-performing agents, and allocate resources where they will have the greatest impact on the customer experience.
To put these insights to work, follow these actionable steps:
- Prioritize Your Focus: Don't try to overhaul everything at once. Select one or two KPIs that align with your most urgent business goals. If customer churn is a problem, start with Customer Retention Rate and NPS. If operational efficiency is the priority, focus on Average Response Time and FCR.
- Establish Clear Baselines: You cannot improve what you don't measure. Use your initial data to establish a performance baseline. This benchmark becomes the starting point against which all future efforts and initiatives are measured.
- Empower Your Team: Share KPI data and insights with your frontline agents. When your team understands the "why" behind the metrics and sees how their individual performance contributes to the bigger picture, they become more engaged and motivated to excel.
Ultimately, the power of these key performance indicators for customer service lies not in the numbers themselves, but in the momentum they create. Each incremental improvement, each resolved issue, and each satisfied customer builds upon the last, fostering a cycle of continuous enhancement. This journey from metrics to momentum transforms your customer service from a cost center into a powerful engine for sustainable growth and unwavering brand loyalty.
Ready to stop guessing and start measuring what truly matters? My AI Front Desk provides a powerful, AI-driven platform to track, analyze, and optimize your customer service KPIs automatically. See how our intelligent call summaries and analytics can transform your data into a competitive advantage by visiting My AI Front Desk today.