When you're running a call center, you're constantly juggling resources—your agents' time, the technology they use, and of course, your budget. Call center efficiency metrics are the key performance indicators (KPIs) that tell you how well you're managing that juggling act.
Think of them like the instruments on a race car's dashboard. They give you the hard data you need to find that perfect balance between speed and quality, helping you keep costs down while making customers happy.
Quick Guide to Core Call Center Efficiency Metrics#
Before we dive deep, here’s a quick overview of the essential metrics we'll be breaking down. This table gives you a snapshot of what each one measures and why it’s a non-negotiable part of your performance toolkit.
Each of these metrics tells a part of the story. Together, they paint a complete picture of your call center's health and point the way toward meaningful improvements.
Why Call Center Efficiency Metrics Are Your North Star#
Let's stick with the racing analogy. Imagine your call center is a high-performance team where every split-second decision can make or break the race. In this high-stakes game, your metrics aren't just numbers on a spreadsheet; they're the critical readouts on your dashboard, guiding every strategic turn.
Mastering these KPIs is the first step in moving your team from a reactive, fire-fighting mode to a proactive, value-driving operation. They give you a clear, unbiased look at your operational health, taking the guesswork out of your decisions and replacing it with solid data.
Balancing Speed and Quality#
One of the oldest tug-of-wars in any call center is the one between speed and quality. It's incredibly tempting to push for faster call times and quicker resolutions. Who doesn't want that? But if you chase speed at the expense of a good customer experience, you're setting yourself up for failure.
This is where efficiency metrics really prove their worth.
- Speed-related metrics like Average Handle Time (AHT) show you how quickly agents are getting through interactions.
- Quality-related metrics like First Call Resolution (FCR) tell you if those quick resolutions are actually sticking.
A low AHT might look fantastic on a report, but if it causes your FCR to drop and you have frustrated customers calling back again and again, you’ve wiped out any "efficiency" you thought you gained. Real efficiency is finding that sweet spot where your team is fast, but they’re also getting it right the first time.
The goal isn't just to be fast; it's to be effectively fast. An efficient call center resolves issues swiftly and correctly, ensuring that customer loyalty isn't sacrificed for the sake of speed.
Impact on Your Business Bottom Line#
At the end of the day, tracking these KPIs has a direct and measurable impact on your company's financial health. When you focus on the right metrics, you can make small, precise tweaks that deliver big returns.
For example, improving your FCR by just a few percentage points can slash your operational costs by cutting down the number of repeat calls. It's a simple equation with a powerful outcome.
Likewise, using call arrival data to optimize agent schedules ensures you have the right number of people on deck during peak hours. This simple act prevents both wasted payroll on overstaffing and high call abandonment rates from understaffing. For a closer look at which KPIs to focus on, our guide on 8 key call center metrics examples for 2025 offers some great starting points.
Throughout this guide, we'll unpack how each of these metrics works together to build a complete picture of operational excellence.
The Power of Solving It Right the First Time#

If you had to pick just one metric to gauge your call center's performance, First Call Resolution (FCR) would be a serious contender. Think about it in real-world terms. When you have a problem at home and the technician fixes it on their first visit, you’re not just happy—you're relieved. You instantly trust their competence. That's the exact feeling FCR delivers to your customers.
FCR isn't just a percentage; it’s a direct pulse check on your entire support operation. A high FCR is a sign of a healthy system—your agents are well-trained, your processes are solid, and your resources are effective. On the flip side, a low FCR is a major red flag. It means customers are stuck in a frustrating cycle of repeat calls, and their trust is wearing thin with every new interaction.
How to Calculate First Call Resolution#
Getting an accurate FCR calculation is the foundation for understanding what’s really going on. The formula itself is simple, but its power comes from using it consistently.
FCR (%) = (Total Number of Calls Resolved on the First Attempt / Total Number of Unique Incoming Calls) x 100
What’s a "unique" call? It’s a call that isn't a follow-up from the same customer about the same issue within a set timeframe, typically 24-48 hours. A common pitfall is misclassifying these follow-ups, which can make your FCR look better than it is while hiding deep-rooted problems. Nailing down a clear, consistent definition of "resolved" is your first and most important step.
Industry benchmarks show just how critical FCR is. As of 2025, top-performing call centers are hitting an FCR of 74% or higher. That means they’re solving nearly three out of every four issues without needing a single follow-up. This directly boosts customer satisfaction while sharpening operational efficiency.
Why FCR Is a Game-Changer for Efficiency#
A strong FCR sends a positive ripple effect through your entire call center, touching everything from your budget to team morale. The benefits are impossible to ignore.
- Reduced Operational Costs: Every single repeat call costs you money. It ties up your agents, clogs your phone lines, and stops your team from helping new customers. By solving problems on the first contact, you directly slash unnecessary call volume and lower your overall cost per call.
- Increased Customer Loyalty: Nothing annoys a customer more than having to repeat their problem to multiple agents. A high FCR shows you respect their time and builds a rock-solid foundation of trust. Happy customers are loyal customers.
- Improved Agent Morale: Dealing with angry, frustrated repeat callers is exhausting. When agents have the knowledge and tools to solve issues the first time, their job satisfaction skyrockets. This leads to lower turnover and a far more motivated team.
Actionable Strategies to Boost Your FCR#
Improving your FCR isn't about just telling agents to "try harder." It takes a strategic approach that focuses on giving them the right tools and refining your processes. The goal is to tear down any roadblocks that stand in the way of a one-call solution.
For instance, give your agents a robust, easily searchable knowledge base so they can find answers instantly. Overhaul your training to focus on root cause analysis, empowering them to diagnose the real problem instead of just putting a band-aid on the symptoms. For a complete guide, check out our article on how to improve First Call Resolution with proven strategies.
At the end of the day, FCR is the metric that best connects operational efficiency with customer happiness. When you focus on getting it right the first time, you create a true win-win: your customers get the effortless support they crave, and your business enjoys the benefits of a highly efficient, cost-effective operation.
Finding the Sweet Spot with Average Handle Time#
Average Handle Time (AHT) might be one of the most misunderstood metrics in any call center. It’s all too easy to look at it like a golf score, where the only goal is to get the number as low as possible. But chasing a low AHT at all costs is a bit like a chef rushing a five-course meal—sure, it gets to the table faster, but nobody's going to enjoy the result.
At its core, AHT measures the entire lifecycle of a single customer interaction, from the moment it starts to the second it’s fully resolved. It's not just one thing; it's a blend of three distinct phases of an agent's work.
Deconstructing Average Handle Time#
To really get a grip on AHT, you have to pull it apart and look at its individual pieces. Each component tells a different story about your team's efficiency and where the real bottlenecks are.
- Total Talk Time: This is exactly what it sounds like—the time your agent spends actively speaking with the customer. It's the heart of the interaction, where problems get solved and relationships are built.
- Total Hold Time: This tracks any time the customer is put on hold. An agent might do this to check with a supervisor, dig up some complex information, or transfer the call to another department.
- After-Call Work (ACW): Often just called "wrap-up time," this is all the essential work an agent does right after hanging up. Think logging call notes, updating the CRM, shooting off a follow-up email, or handling other admin tasks tied to the call.
The formula itself is just simple addition and division:
AHT = (Total Talk Time + Total Hold Time + After-Call Work) / Total Number of Calls
Breaking it down like this is crucial. It helps you see exactly where the friction is. A long talk time isn’t automatically a red flag, but high hold times or bloated ACW often point to a process that needs fixing.
The Myth of the "Perfect" AHT#
Let’s be clear: there is no universal "good" AHT. A quick, two-minute call to confirm an appointment is a world away from a 30-minute tech support call to troubleshoot a tricky software bug. That second call is long, but if it solves the customer's problem and leaves them happy, it’s a huge win.
Focusing only on driving down AHT can backfire spectacularly. When agents feel pressured to wrap up calls, they start cutting corners, giving incomplete answers, and rushing customers off the phone. This absolutely torpedoes your FCR and sends customer satisfaction scores into a nosedive. A short but ineffective call is the most inefficient one you can have—it practically guarantees a callback.
The real goal isn't a low AHT; it's an optimized AHT. You're looking for that sweet spot where agents are efficient but also thorough enough to deliver a great experience that sticks.
Strategies for Intelligent AHT Optimization#
Instead of just telling your team to "be faster," focus on removing the roadblocks that are inflating handle times in the first place. This is how you boost efficiency without sacrificing quality.
Streamline After-Call Work:
ACW is often a goldmine for quick efficiency wins. If agents are spending a few minutes after every single call on manual data entry, you've found your starting point.
- Use CRM integrations that automatically log call details.
- Create standardized templates for common follow-up emails.
- Implement simple disposition codes that agents can select with a single click.
Empower Agents with Better Tools:
Long hold times are often a symptom of an agent struggling to find information.
- Build a centralized, easily searchable knowledge base.
- Provide real-time AI assistance that can suggest answers or next steps during a call.
- Make sure your internal systems are fast and responsive, not slow and clunky.
This strategic approach lines up with what we see across the industry. While AHT benchmarks in 2025 can range from 5 to 7 minutes depending on the sector, the best call centers know it's a balancing act. Many pair their AHT goals with their Average Speed of Answer (ASA), aiming to answer 80% of calls within 20 seconds. Some are even pushing that to 90% in 15 seconds to cut down wait times without hurting the quality of the actual conversation. You can see more on how top performers manage these trade-offs in this in-depth analysis of key benchmarks.
By focusing on smart, targeted optimizations, you can lower your AHT for all the right reasons, making your agents more productive and your customers much happier.
Building a Complete Performance Picture#
Relying just on First Call Resolution (FCR) and Average Handle Time (AHT) is like trying to drive a car with only a speedometer and a fuel gauge. They're essential, but they don't give you the full story. To get a complete, panoramic view of your call center's health, you need a full dashboard of supporting call center efficiency metrics that all work together.
This approach moves you beyond isolated numbers. It helps you diagnose performance issues with incredible precision because you start to see the why behind the what. You're connecting the dots between different KPIs to understand the full narrative.
Monitoring Your Waiting Room with Abandonment Rate#
One of the most revealing metrics is your Call Abandonment Rate. Think of your call queue as the line for a popular new restaurant. If that line is barely moving and stretches around the block, people will get frustrated, give up, and walk away. A high abandonment rate tells you exactly that is happening in your virtual lobby.
It's a straightforward calculation: the percentage of callers who hang up before ever speaking to a human.
Call Abandonment Rate (%) = (Number of Abandoned Calls / Total Number of Incoming Calls) x 100
Anything above 5% is usually a red flag. This often points directly to excessive wait times, which could be caused by understaffing, clunky call routing, or just poor agent scheduling during your busiest hours.
Gauging Responsiveness with Average Speed of Answer#
Tied directly to abandonment is the Average Speed of Answer (ASA). This metric is a pure measure of your team's accessibility. It tracks, on average, how long a caller waits in the queue before an agent picks up. No talk time, no after-call work—just the wait.
A high ASA is a guaranteed way to annoy customers and send your abandonment rate climbing. Watching this in real-time gives managers the power to make quick adjustments, like pulling agents from other tasks to tackle the inbound queue if it starts to balloon. A common industry benchmark is to answer 80% of calls within 20 seconds.
Finding Balance with Agent Occupancy Rate#
Finally, let's talk about the Agent Occupancy Rate. This metric shows you what percentage of an agent's logged-in time is spent on actual call-related activities—talking, holding, and after-call work—versus sitting idle and waiting for the next call.
It's all about finding the sweet spot. Picture a cashier at a grocery store:
- High Occupancy (95%+): The cashier is a whirlwind of activity, scanning items nonstop without a moment to breathe. It looks super efficient on paper, but it's a fast track to exhaustion, errors, and burnout.
- Low Occupancy (50%): The cashier is just standing around half the time. From a business perspective, that's a waste of resources and money.
A healthy occupancy rate usually lands somewhere between 80-85%. This keeps agents productive and engaged without pushing them to their breaking point.
As you build out this complete performance picture, it’s also smart to look beyond the call center itself. Understanding broader business goals, like the top sales efficiency metrics, can provide a richer context for your operational success.
The image below shows how these core practices fit together to support overall efficiency.
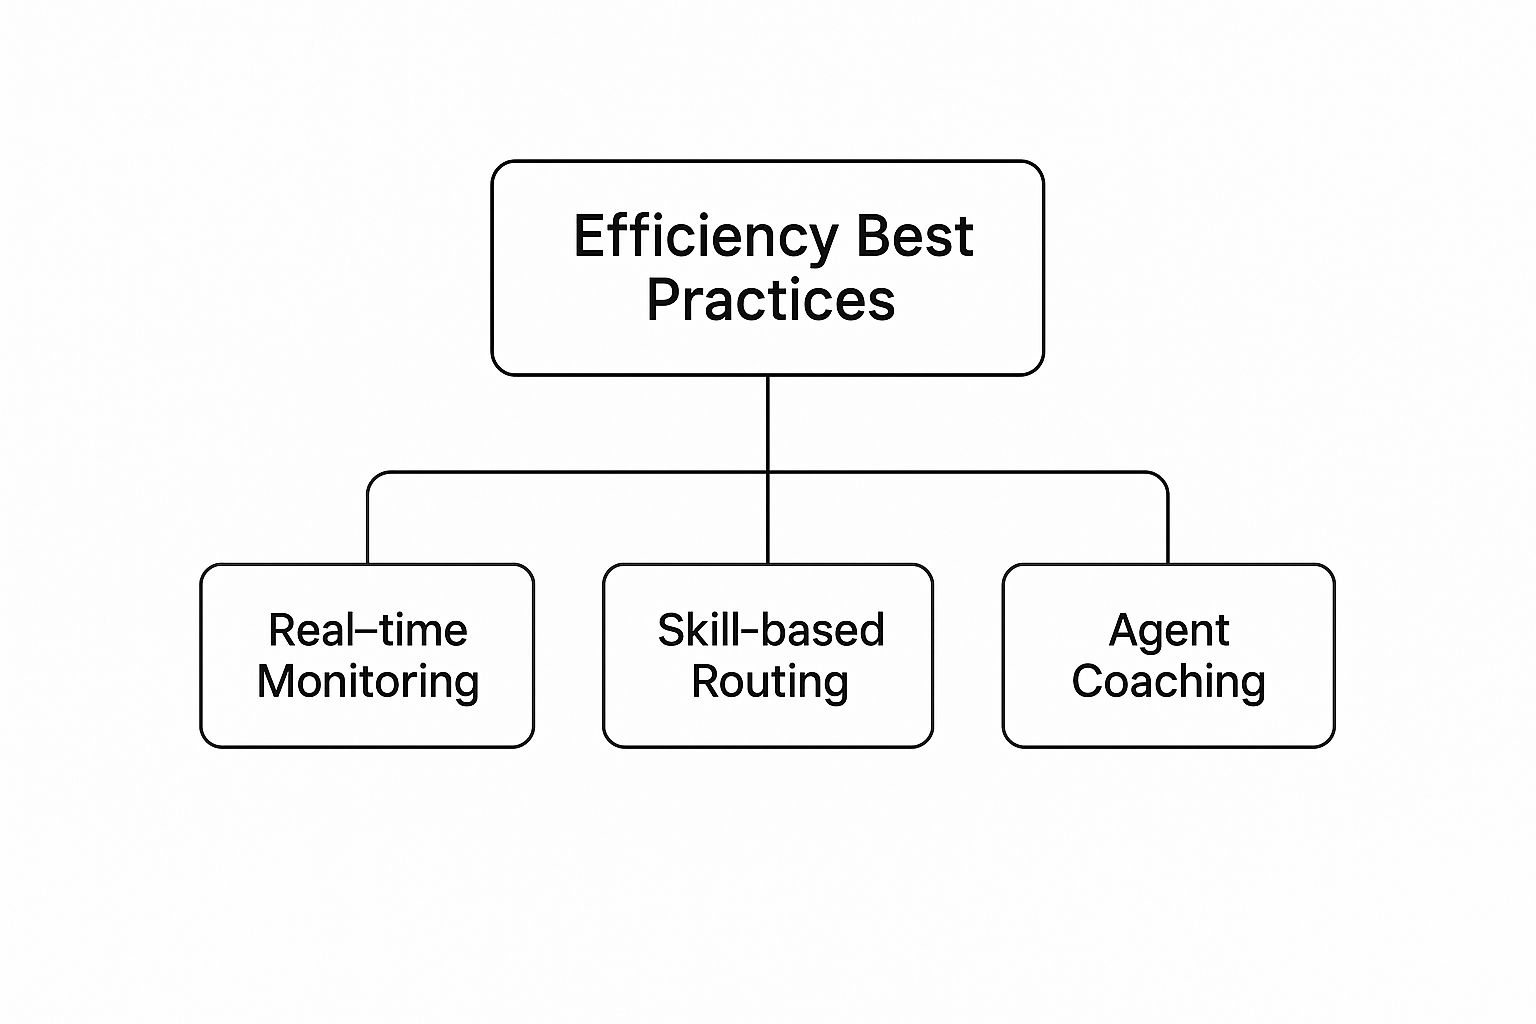
As you can see, foundational tools like skill-based routing and real-time monitoring are the pillars that hold up effective agent coaching and, ultimately, better performance. By mastering a broader set of KPIs, you can create an operation that’s truly balanced and effective. To explore this topic in more detail, you can continue by mastering call center performance metrics in our comprehensive guide.
Putting Your Call Center Metrics Into Action#

Okay, so you understand the individual metrics. That's a great start. But the real magic happens when you stop looking at numbers in isolation and start using them to drive meaningful change. It's time to turn that raw data into a clear roadmap for growth.
This all starts by connecting your call center efficiency metrics directly to what your business is trying to achieve. Is the main goal to slash operational costs, or is it to create an unforgettable customer experience? Your answer will dictate which metrics you live and breathe by.
A cost-focused center will obsess over Average Handle Time (AHT), while one dedicated to customer experience will stake its reputation on First Call Resolution (FCR) and CSAT scores.
Aligning Metrics With Business Goals#
The best metric strategies are never one-size-fits-all. They need to be hand-picked to reflect what truly matters to your organization. This alignment is what ensures every single agent’s effort is pushing the company’s mission forward.
Just ask one simple question: "What does success look like for us?" Once you have a clear answer, you can choose the metrics that actually measure progress toward that specific vision.
- For Cost Reduction: You'll want to prioritize metrics like Cost Per Call (CPC) and Agent Occupancy. The goal here is simple: maximize every resource and cut out the waste.
- For Customer Loyalty: Your North Star will be First Call Resolution (FCR) and Net Promoter Score (NPS). In this case, the quality of the conversation matters far more than its length.
- For Operational Agility: Keep a sharp eye on Average Speed of Answer (ASA) and Call Abandonment Rate. These numbers tell you how quickly you can respond to customer needs when they arise.
When you select the right KPIs, you build a system where the daily grind on the call center floor directly fuels high-level business strategy. That connection is the bedrock of a genuine data-driven culture.
Building Actionable Dashboards and Reports#
Data is completely useless if it's trapped in a complicated spreadsheet that no one ever looks at. To make your metrics work for you, they need to be displayed in simple, easy-to-read dashboards. Thankfully, modern call center software makes this easier than ever, letting you build custom views for everyone on your team.
For an agent, a dashboard should be their personal scorecard. It needs to clearly show their FCR, AHT, and customer satisfaction ratings. This empowers them to see their own progress, spot areas for improvement, and take real ownership of their performance.
For managers, dashboards need to paint a bigger picture. They should highlight trends in call volume, overall team occupancy, and FCR for the entire group. This is what allows them to make smart decisions about staffing, scheduling, and identifying which agents might need a bit of extra coaching.
A well-designed dashboard doesn't just show data; it tells a story. It should immediately scream, "This is working well," "This is a problem," and "Focus your attention right here for the biggest impact."
Fostering a Culture of Continuous Improvement#
Rolling out a new metrics program can be tricky. If you handle it the wrong way, it can feel like micromanagement and breed a culture of fear. The key is to frame metrics as tools for coaching and empowerment, not as weapons for criticism.
Start with total transparency. Explain to your team exactly which numbers you're tracking, why they matter to the business, and how they contribute to everyone's success. When agents get the "why" behind the numbers, they're much more likely to get on board.
Use data to have positive, constructive coaching sessions. Instead of saying, "Your AHT is too high," try something like, "I noticed your AHT is a little longer on these specific call types. Let's dig in together and see if a different process or tool could make those feel smoother." This collaborative approach builds trust and encourages genuine growth.
This also means investing in the right technology. Using effective call quality monitoring software you should know can give you the concrete call examples you need for targeted, fair coaching.
Ultimately, you want to create a positive feedback loop. Data guides improvement, that improvement boosts morale, and motivated agents deliver better results. This is how you transform metrics from a top-down directive into a shared goal for the entire team.
Common Traps in Metric Management and How to Avoid Them#
Even the sharpest leaders can fall into some common traps when managing call center efficiency metrics. These pitfalls can quickly turn a system designed for improvement into a source of stress, bad habits, and unhappy customers. The first step to building a healthy, data-driven culture is knowing what these traps look like.
One of the biggest dangers is metric fixation. This is what happens when a team becomes obsessed with hitting a specific number—like a low Average Handle Time (AHT)—and loses sight of the real goal: actually helping the customer. Agents might start rushing callers off the phone or giving half-baked answers just to keep their times down. This inevitably tanks First Call Resolution (FCR) and sends customer satisfaction scores through the floor.
It creates a nasty domino effect. "Improving" one metric actively harms another, leading to a frustrating experience for both your agents and your customers.
Moving Beyond Single-Metric Thinking#
The best way to break free from metric fixation is to adopt a more balanced view. Never, ever judge performance based on a single KPI. Instead, think of it like a "balanced scorecard" where you look at several connected metrics all at once.
For example, when you're looking at an agent’s AHT, you absolutely must look at their FCR and Customer Satisfaction (CSAT) scores from the same time period.
Here’s how to read the story the numbers are telling:
- Low AHT + High FCR/CSAT: This is the dream. It points to a highly efficient and effective agent who resolves issues quickly and correctly.
- Low AHT + Low FCR/CSAT: This is a huge red flag. It’s a strong sign that the agent is rushing, cutting corners, and likely creating more problems than they solve.
- High AHT + High FCR/CSAT: Don't jump to conclusions here. This often indicates an agent who is incredibly thorough, maybe tackling more complex issues that others can't. This isn't a problem; it's a strength.
This holistic approach gives you the full picture. It shifts the entire team’s focus from chasing an isolated number to delivering a consistently great outcome.
Framing Data as a Tool for Coaching#
How you talk about data with your team matters just as much as the data itself. If metrics are only brought up for criticism or to pit agents against each other on a leaderboard, you're building a culture of fear. Agents will start hiding problems or cherry-picking easy calls just to protect their stats.
The most powerful shift you can make is to frame metrics as a tool for coaching, not a weapon for criticism.
Instead of just pointing out a low score, use the data to start a supportive conversation. Ask questions like, "I see our FCR has dipped for this issue type. What's getting in your way?" This simple change turns managers into allies and empowers agents to ask for the support they actually need.
When you focus on collaboration, you ensure your metrics drive genuine improvement, not just anxiety.
Frequently Asked Questions#
Even when you've got a handle on the key call center efficiency metrics, you'll inevitably run into some real-world questions. Let's tackle a few of the most common ones that come up for managers and agents trying to put these numbers to work.
What Is the Difference Between Efficiency and Productivity Metrics?#
This is a big one. While they sound alike, "efficiency" and "productivity" are two totally different sides of the performance coin.
Imagine you're building a house.
- Productivity is all about output. It answers the question, "How many bricks did we lay today?" In your call center, a productivity metric like Calls Handled Per Hour simply tracks the sheer volume of work getting done.
- Efficiency is about the quality of that work and how you used your resources. It asks, "How well did we lay those bricks, and how many did we waste?" Efficiency metrics like First Call Resolution (FCR) measure if you did the job right the first time, without wasting anyone's time.
The best call centers strike a careful balance. Chasing high productivity without paying attention to efficiency will just lead to rushed, sloppy work and a lot of unhappy customers. On the flip side, being perfectly efficient but only helping a handful of people isn't a winning strategy either.
The real difference is simple: Productivity measures how much you do, while efficiency measures how well you do it. You need both to succeed.
How Often Should We Review Our Metrics?#
The right rhythm for reviewing metrics really depends on what you're trying to achieve with them. You wouldn't check your annual budget every ten minutes, right? And you wouldn't look at real-time call queues only once a month.
Here’s a good cadence to start with:
- Real-Time (Hourly/Daily): These are your operational metrics. Think Average Speed of Answer (ASA) and Call Abandonment Rate. Supervisors need to keep a constant eye on these to manage the daily workflow, adjust staffing on the fly, and prevent backlogs.
- Weekly/Bi-Weekly: Agent-specific metrics like Average Handle Time (AHT) and FCR are perfect for one-on-one coaching. Looking at these weekly helps you spot trends, celebrate improvements, and give targeted support where it's needed most.
- Monthly/Quarterly: This is where you zoom out. Use these higher-level reviews to analyze strategic metrics that inform the big-picture decisions—things like new training programs, technology investments, and overall business goals.
Can Focusing Too Much on Metrics Hurt Agent Morale?#
Absolutely, but only if they're used as a weapon. When metrics are twisted into a tool for micromanagement or punishment, they create a high-stress "Big Brother" environment that will absolutely crush morale. That’s not a support system; it’s a surveillance system.
But when you frame them correctly, metrics can be incredibly motivating.
The secret is to be transparent about what you’re tracking and, more importantly, why it matters. Use data to kick off positive coaching conversations, celebrate individual and team wins, and figure out where your agents need more support—not just to point out what they’re doing wrong.
Empower your team and boost efficiency with My AI Front Desk. Our AI receptionist and outbound dialer handle calls, qualify leads, and schedule appointments, freeing your team to focus on high-value conversations. See how it works.