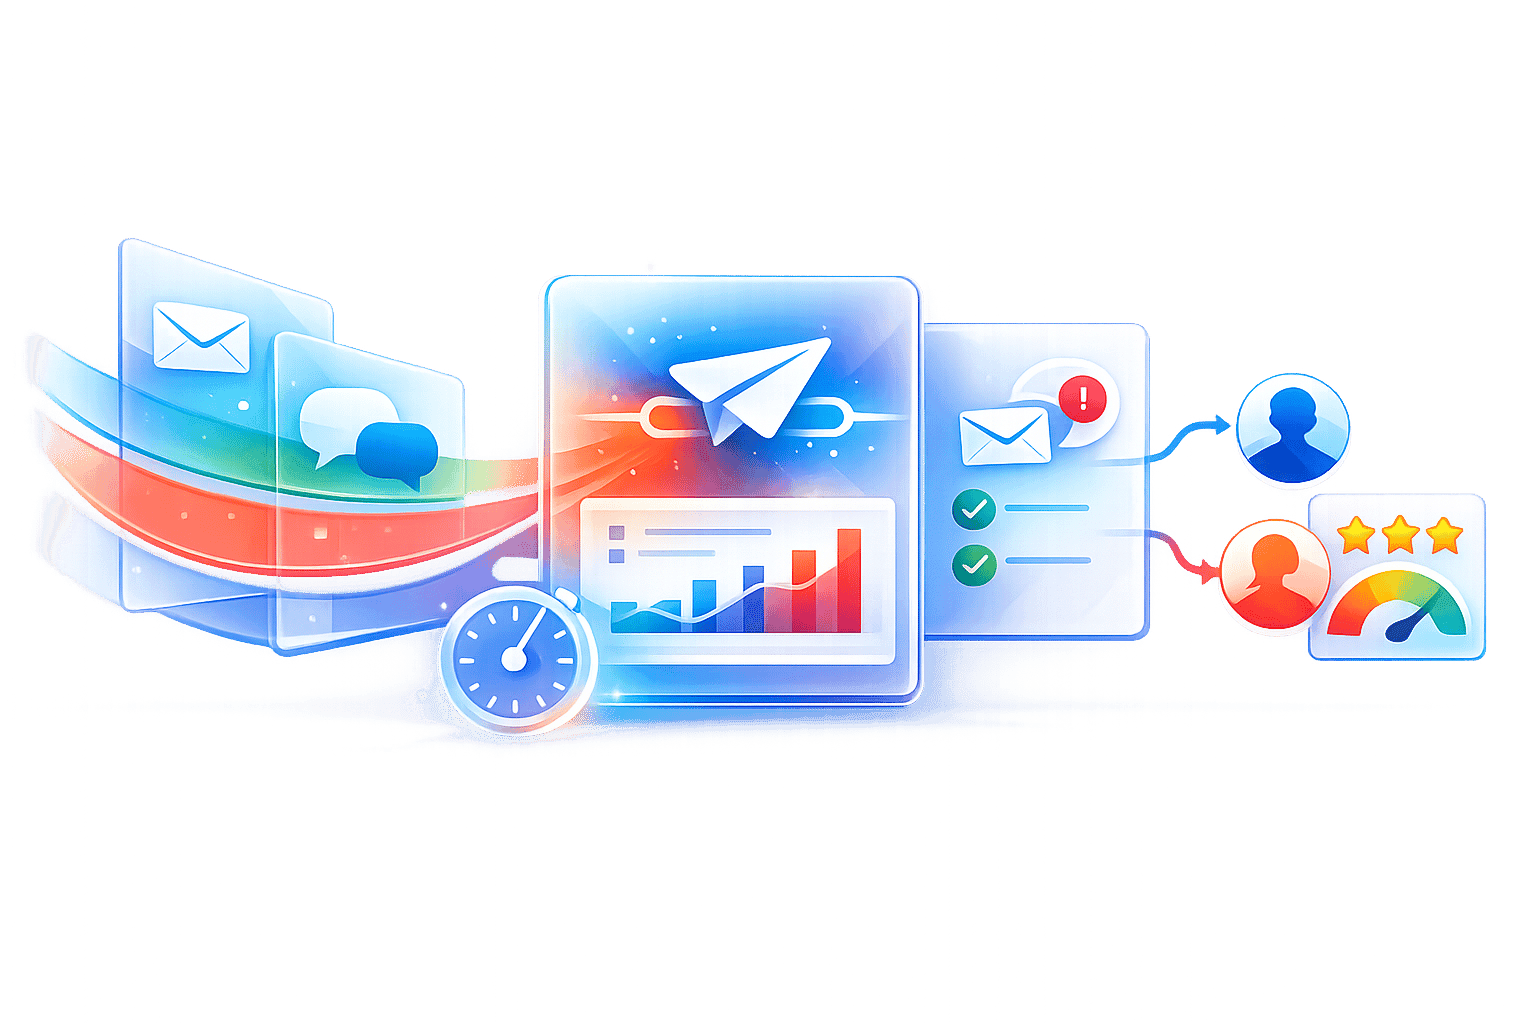
Building a call center dashboard for real-time performance isn’t just for big companies anymore—it’s something every business should think about. With customers expecting fast answers and smooth service, having a dashboard makes it easier to spot problems, track what’s working, and keep your team on the same page. Instead of waiting for end-of-week reports, you can see what’s happening right now and make changes before little issues turn into big headaches. Whether you’re running a small team or a big operation, a good dashboard helps everyone—from agents to managers—work smarter and keep customers happy. Here’s what you need to know to get started.
Key Takeaways#
- A call center dashboard gives you a real-time window into your team’s performance, so you can act fast instead of waiting for reports.
- Pick metrics that actually matter for your business—don’t just track everything or you’ll end up drowning in data.
- Connecting your dashboard to all your tools (like your CRM and phone system) keeps your data in one place and makes sure it’s accurate.
- A dashboard isn’t just for managers—design it so agents, supervisors, and execs all get what they need without extra clutter.
- Don’t forget about security and privacy; make sure only the right people can see sensitive info and that your system follows the rules.
Understanding the Call Center Dashboard and Its Strategic Value#
A call center dashboard isn’t just another piece of software—it’s the nerve center for busy teams, letting managers and agents see what’s happening right now, spot patterns, and react quickly. A well-organized dashboard turns raw data into actionable decisions, reducing chaos and guesswork on hectic days. Fast decisions are much easier when everything you need is laid out in one place and easy to understand.
Key Roles of a Call Center Dashboard#
Call center dashboards pull together and display the numbers that matter most to operations, right as they happen. Here are the main jobs a dashboard handles:
- Monitoring real-time activity: Managers see call volumes, agent status, wait times, and more, so they know when to step in.
- Tracking team performance: From first call resolution to average handle time, metrics show where the team is winning and where things need work.
- Spotting service gaps: Dashboards flag spikes in abandoned calls or drops in satisfaction, helping prevent small issues from becoming major headaches.
- Promoting better communication: Sharing real-time info across teams keeps everyone pulling the same way. For example, promoting targeted offers or coordinating follow-ups gets much simpler when you’re using a tool that streamlines appointments and lead management, as seen with AI receptionist solutions.
Call Center vs Contact Center Dashboards#
While both types help manage support operations, there’s a difference worth knowing:
So, if your company uses just phones, the call center dashboard is your tool. If your support spreads across texts, chat, and email—think broader with a contact center dashboard.
Influence on Customer Experience#
It’s easy to underestimate how directly dashboards impact customers. Here’s why they matter:
- Less waiting: Real-time queue tracking helps fix long wait times quickly, so fewer customers get frustrated and hang up.
- Consistent answers: When agents see clear, up-to-date info, they’re less likely to give confusing or conflicting responses.
- Faster problem-solving: By sharing outcomes, customer feedback, and even transcripts across departments, agents are prepared for follow-up questions or complicated cases—something AI-powered support tools improve by repeating fewer steps and maintaining consistent quality.
When your dashboard brings together the right information at the right moment, everyone—from managers to front-line agents—has a fighting chance to turn every call into a win, not a missed opportunity.
Ultimately, a dashboard is much more than a scorecard; it’s a living, breathing tool for making customer experience better one call at a time.
Selecting Essential Metrics and KPIs for Real-Time Insights#

The real magic of a call center dashboard comes down to what you measure. Choosing the right metrics and KPIs is what separates guesswork from confident, quick decisions. Here’s where to start—and how to strike a balance so your dashboard doesn’t just look pretty, but actually works.
Crucial Metrics to Monitor#
There are a bunch of numbers you could track, but let’s be honest—only some really matter for real-time action:
- First Call Resolution (FCR): Calls solved on the first try, a stress-reliever for customers and agents alike.
- Average Handle Time (AHT): Time spent on each call, including talk and wrap-up. Too high? You’ve got a slowdown. Too low? Maybe quality is tanking.
- Customer Satisfaction Score (CSAT): Usually a quick post-call survey—if folks are happy, you’ll know.
- Average Wait Time: Nobody likes waiting, so keep this as low as possible.
- Call Abandonment Rate: Shows how many folks hung up before getting help—a key signal for real-time staffing tweaks.
Sometimes, the right dashboard spotlight on FCR or Abandonment Rate can make all the difference between a calm day and chaos—and lets managers react instantly before small hiccups become big problems.
Balancing Speed and Quality#
If you only measure speed, agents might rush and miss details. If you just push for quality, queues could spiral out of control. The best dashboards combine a few related KPIs—so you can spot when speed and quality are both where they should be.
- Set up alerts when both AHT and FCR hit their targets together—there’s your sweet spot.
- Compare CSAT with Wait Time during peak hours to make sure customers stay satisfied even under pressure.
- If you’re doing outbound, track connect rate vs. handle time to fine-tune campaign effectiveness.
Aligning KPIs with Business Goals#
Every call center is a bit different. Before putting any numbers on the screen, take a step back:
- Figure out what really matters to your business—growth, retention, cost control, etc.
- Pick KPIs that match those outcomes (support teams might chase FCR and CSAT; sales teams track conversion rates and revenue per call).
- Set targets and review them regularly—seasonal shifts or team changes mean you’ll need to tweak as you go.
- If your business handles seasonal swings, like tax season or holiday rush, set up dynamic targets for Wait Time and Abandonment Rate.
- For advanced teams, tie dashboard KPIs into agent goals using tools like integrated analytics or smart dashboards (advanced dashboard features).
By picking the right KPIs, carefully tracking them side by side, and keeping an eye on your business goals, your dashboard becomes less of a pretty chart and more of a steering wheel for day-to-day performance.
Integrating Data Sources for a Unified Dashboard View#

If you want your call center dashboard to actually show what's happening, you’ll need everything plugged in and talking together. Otherwise, you get partial info and everyone’s flying half-blind. Here’s how to stitch those data sources together the right way.
Connecting CRM and Telephony Systems#
Combining call data with customer records is the backbone of any dashboard worth using. A unified link between your CRM and your phone system lets agents see the full story behind each call—previous interactions, notes, follow-ups, and outcomes—all in one place.
Some practical steps:
- Choose platforms with built-in integrations (like those with direct connections or solid API support, for example, with AI-powered receptionists that hook into multiple CRMs).
- Automate pushing call records and outcomes into customer profiles immediately after a call ends.
- Set up two-way syncs so updates travel both ways—no more manual updates or duplicate work.
It pays to map out your workflows first, so you know what info needs to travel where, and which team gets what.
Enabling Multi-Channel Data Streams#
People want to get help by phone, text, chat, or email. Your dashboard should track it all. Just tracking phone calls only gives half a picture. With multi-channel data:
- You can see conversation context, no matter if someone switches from chat to a phone call.
- Customers don’t have to repeat themselves, and agents see prior history right away.
- Performance stats cover every channel, helping you spot patterns, gaps, and response times.
Here’s a quick table of what a unified stream could look like:
The right platform should gather everything automatically. If you’re manually exporting chat logs into a spreadsheet, it’s time for an upgrade.
Ensuring Data Accuracy and Consistency#
With all these data streams feeding in, errors multiply if you’re not careful. Here’s what you’ll want to keep an eye on:
- Standardize how data is labeled (make sure "Customer Name" isn’t sometimes "Client" in another system).
- Use automation to push updates instantly, avoiding lag or old info.
- Audit your integrations regularly—stuff breaks, and you won’t always notice until you get weird reports.
Keeping your dashboard accurate means not getting caught off guard. Outdated or inconsistent info leads to bad decision-making, missed opportunities, and, honestly, a lot of avoidable headaches.
Integrated dashboards should feel boring and predictable—everything in sync, nothing missing, and the whole team confident that the data is the truth, not a guess.
Designing User-Centric Call Center Dashboards#

Building a dashboard that people actually like using is a lot harder than it looks. You want something practical—fast, uncluttered, and set up so each team member can spot what's most important without guessing. There's no magic formula, but a thoughtful approach makes all the difference.
Optimizing Layouts for Fast Decisions#
Speed is everything in a busy call center. If someone opens the dashboard and has to scan around for five minutes, it completely defeats the purpose. Here's how to keep it quick and easy:
- Put the most important numbers—like active call volume and average wait time—right up top.
- Use clear groupings: keep related stats close together so agents and supervisors don’t have to hop around the screen.
- Limit clutter. Only show essential details that actually drive action for your team.
A dashboard should act like a smart assistant—offering clear answers, not burying users in information.
Role-Based Customization#
Everyone who logs in wants different info, so a one-size-fits-all dashboard never works. Customizing by role keeps things relevant:
- Agents: focus on personal metrics like First Call Resolution (FCR), daily call totals, and their latest customer feedback.
- Supervisors: monitor team averages, queue backlogs, and service level agreement (SLA) compliance.
- Executives: see big-picture statistics—trends, customer satisfaction, and cost efficiency.
Some services like AI phone receptionist for optometry offices even let you fine-tune user views so front desk staff aren't bombarded with high-level analytics meant for managers.
Applying Color and Visual Hierarchy#
You might not think colors matter that much, but try spotting a problem metric in a sea of bland. It’s impossible. The right use of color and placement can solve this and more:
- Color codes: Red for urgent issues (like spike in abandonments), green for normal, yellow for warnings. This way, even new team members know what needs attention.
- Visual hierarchy: Bigger fonts or bold outlines for the most critical numbers; shrink or fade the less urgent ones.
- Subtle backgrounds or icons to group related metrics without overwhelming the eyes.
If you’re using platforms like Dorxata’s AI receptionist solutions, you’ll notice premium analytics dashboards use this logic—fast visuals, good spacing, bold alerts where it counts.
- Keep primary call stats front and center
- Use clear, contrasting colors for priority metrics
- Place actionable alerts near the area where decisions get made
Simplicity always wins. If your team can spot trends and problems at a glance, your dashboard is doing its job.
Implementing Real-Time Monitoring and Alert Systems#
When you set up a call center dashboard for real-time visibility, you’re putting yourself in a much better spot to react to issues as they pop up, not when it’s already too late. A live dashboard makes potential problems obvious, so you don’t have to wait for a report to tell you the building’s on fire. Here’s how to bring real-time monitoring and alerting into your call center routines:
Setting Up Live Data Feeds#
Building a good real-time dashboard starts with wiring it into the right data pipes. You want every key system—phone, CRM, even your latest AI-powered receptionist or virtual agent (virtual AI receptionist platform)—feeding into your dashboard.
- Connect your telephony and CRM systems to send up-to-the-second call and agent data.
- Include supporting data streams like automated SMS, call transfers, and customer sentiment inputs.
- Check that the feeds update in true real-time, not on a delay, so decisions are always based on what’s actually happening right now.
A simple breakdown of recommended sources:
Configuring Threshold-Based Notifications#
Not every spike in call volume needs a meeting. But some things definitely do. If you trigger a notification every time something minor happens, you’re going to tune out and miss the big stuff—classic alarm fatigue. The trick? Set clear thresholds for alerts, focusing on what really matters.
- Focus on KPIs that change quickly: high abandonment rate, long queue times, urgent customer feedback.
- Use business hours and seasonal averages for the threshold, not just a random number out of thin air.
- Build tiered alerts: yellow for mild issues, red for emergencies. Some dashboards even let you automatically escalate to a manager if something hits the redline.
Sample Notification Rules
Minimizing Response Latency#
Even with all the right monitoring, slow action kills momentum. The faster you spot and react to issues, the less disruption for your team and customers. Plain and simple: lag ruins the whole point of real-time.
- Make sure alerts go directly to the responsible person or team, not through a tangled chain of emails.
- Harness modern tools that push notifications to mobile devices, so supervisors and agents see urgent issues instantly.
- Set up automated actions for common issues—rerouting calls when queues are long, or sending an instant SMS to waiting customers.
- Fast action steps might look like:
If you ever wonder whether quicker alerts make a difference, compare your agent stress levels and customer complaints before and after—they’ll tell you everything you need to know.
Keeping your dashboard snappy, your notifications meaningful, and your response loop tight makes real-time monitoring worth it. When these parts line up, you’re not just watching the chaos—you’re actually steering through it.
Leveraging Historical Data for Trend Analysis and Forecasting#
When it comes to running a call center, you can't just look at what's happening right now. Sure, real-time data is important, but the real story often shows up in the rearview mirror. Historical data helps you spot those big-picture patterns—the ones that tell you if your team is heading in the right direction or about to hit a wall. Using the past to forecast what's coming gives you a fighting chance to stay ahead of surprises and avoid the usual headaches during busy seasons.
Establishing Data Baselines#
If you don't know what's 'normal' for your call center, every little spike or dip in the numbers feels like a crisis. To avoid this chaos, start by setting baselines:
- Review metrics like call volume, handle time, and customer satisfaction from the past year.
- Compare week-to-week and month-to-month results to find stable averages.
- Watch for outliers—unusual jumps or drops—that don't fit the general pattern.
This baseline becomes your measuring stick for future performance, helping you decide which changes are just noise and which mean you need to take action.
Identifying Seasonal Patterns#
Some weeks, calls explode just because it's spring break or a new product went live. Without looking at past data, you’d miss these obvious patterns. Try organizing your metrics like this table:
This makes it easy to see when you'll be busiest, so you aren’t caught unprepared. You can also use these trends to support requests for more resources or justify changes in staffing—showing leadership the cold, hard facts rather than just hunches.
Enhancing Staffing Predictability#
Making smart staffing decisions keeps service levels steady without burning out your team. Here’s a practical approach:
- Look at past months to find regular busy periods.
- Match staffing schedules to predicted call peaks—add agents on Mondays if history repeats itself.
- Use scheduled events, product launches, or promotions as triggers to review forecasted demand.
- Keep an eye on quality scores and customer feedback alongside volume to avoid sacrificing support for speed.
Reliable forecasting is what turns a reactive team into a proactive one. Instead of scrambling to cover sudden call spikes, you’ll know what’s coming and prepare your schedule accordingly, making your call center less stressful for everyone.
Plus, if you’re using modern platforms that allow detailed analytics and scheduling integration—like those described at fully white-labeled AI phone receptionist solution—gathering and applying these insights becomes even easier. Historical trend analysis isn’t just about looking back; it’s about making every upcoming month smoother than the last.
Enhancing Agent Performance Through Actionable Insights#
Driving better individual and team performance in a call center isn’t just about collecting numbers—it’s about making insights easy to see and act on, right from the dashboard. When agents and managers can spot trends, understand context, and react quickly, everyone wins: customers get better service, agents grow, and outcomes improve.
Tracking Individual and Team Metrics#
You can’t improve what you can’t see. A well-structured dashboard gives real-time visibility into agent and team performance, breaking down key numbers so they’re obvious and actionable. Here are some common metrics you may want to show:
Ideally, individual agents see their own stats and history, so it’s easy to keep track and stay motivated. Team leads need comparison views—who’s improving? Who needs a nudge or support? Trends and outliers should pop out, not get lost in endless rows.
Identifying Coaching Opportunities#
Numbers alone don’t explain WHY someone is struggling or succeeding. The dashboard helps dig deeper:
- Spot consistent dips in one agent’s satisfaction scores.
- Cross-check handle times with first call resolution rates—taking longer might be good if it solves complex problems upfront.
- Pinpoint teams or shifts that frequently miss targets during peak times.
Armed with these insights, managers can:
- Drill down to specific calls or issue types for context.
- Listen in or review transcripts where metrics flagged a problem.
- Schedule targeted training on actual weaknesses, not guesswork.
Motivating Self-Improvement#
It’s not just about fixing mistakes. Good dashboards let agents own their development:
- Real-time personal performance graphs or badges for milestones.
- Simple peer benchmarks (e.g., “Top 10% in FCR this week!”).
- Clear, actionable tips based on current performance trends.
When agents can see how their efforts impact results—and what steps to take next—they’re more likely to stay engaged and push themselves. Real growth comes from making improvement visible, specific, and achievable day to day.
At the end of the day, the dashboard should work like a coach, not just a scoreboard. It points out what needs attention, celebrates wins, and guides ongoing skill-building without burying agents in stats they can’t control or interpret.
Automating Workflows and Intelligent Actions via the Dashboard#
Automating routine tasks through your call center dashboard doesn't just save time—it cuts out mistakes and keeps teams focused on actual customer needs. Smart automation can make simple processes disappear in the background, making everything feel almost invisible for both agents and customers.
Customizable Call Handling Sequences#
Setting up dynamic call flows is easier now than ever. Think auto-routing based on caller input, or moving VIPs to the front of the line. Here’s how most modern teams approach it:
- Use "if this, then that" setups for common questions or requests
- Automatically escalate calls if certain conditions are met (like angry customers or sensitive topics)
- Trigger info screens or scripts for agents, so they’re always ready for whatever the caller asks
Automated Text and Email Responses#
Let’s be real—follow-up emails and confirmations get missed constantly if they’re manual. By automating responses right from your dashboard, you give instant answers, which keeps customers happy without extra clicks. Typical automations include:
- Sending order confirmations as soon as a call ends
- Dispatching troubleshooting steps based on customer’s issue
- Alerting customers to schedule changes instantly
Automation isn't about removing the human element. Instead, it's about clearing away the boring, repetitive stuff so your people can actually listen and help.
Streamlining Follow-Up Tasks#
No one wins when callbacks or customer actions fall through the cracks. Set up intelligent triggers so once an agent finishes a call, the next steps are locked in and tracked—no more "Who was supposed to send that?" moments. Workflow automations may:
- Schedule follow-up calls on agent calendars automatically
- Create tickets for unresolved cases without delay
- Assign customer surveys out as soon as a case wraps
These features take aim at those nagging little chores that slow down teams, making everything run smoother day after day.
Ensuring Data Security and Compliance in Dashboard Operations#

If you've ever stressed about who can see what inside your call center dashboard, you're not alone. Keeping access finely tuned is the backbone of any secure system. Start by assigning roles—agents, supervisors, and admins should each get access only to what they need, nothing more. Role-based controls also help reduce the risk of sensitive info slipping into the wrong hands.
Here's what strong access management usually looks like:
- Role-based access: Only grant permissions necessary for each person's job.
- Regular reviews: Check access lists every quarter to weed out outdated or unnecessary permissions.
- Audit trails: Log who views or changes sensitive data so you can trace incidents if needed.
Limiting permissions reduces exposure in the event of a breach. Even a simple oversight, like an ex-employee retaining access, can spiral into bigger problems later on.
Complying with Industry Regulations#
Staying on the right side of the law is a never-ending job in call centers. Most industries are governed by specific rules around data retention, consent, and monitoring—think GDPR, HIPAA, and TCPA. The dashboard itself won't keep you compliant, but it must help you demonstrate that you follow the rules.
Best ways to make compliance less painful:
- Build compliance checks into your reporting—flag out-of-policy activities automatically.
- Ensure call recording and customer data is only stored as long as allowed by law.
- Clearly log customer consent (for call recording or marketing) inside the dashboard.
- Set up regular data purges for old or irrelevant records.
If you're using a service like AI Front Desk, Inc., remember you’re responsible for keeping your data practices compliant, not just the software provider.
Protecting Customer Privacy#
No customer likes the idea that their data might end up who-knows-where. It’s basic respect—and it's also legally mandated. Protecting privacy is about minimizing how much data you show, storing it securely, and avoiding sharing it unless absolutely necessary.
- Mask personal details wherever possible in dashboards, replacing names with IDs.
- Apply encryption for any data stored, especially phone numbers and call transcripts.
- Clearly state in your platform's privacy terms how you collect, use, and protect information—AI Front Desk, Inc.’s privacy policy is a good example.
- Give customers options to request deletion of their info, and document how these requests are handled.
If your dashboard accidentally exposes private info, it’s not just a technical slip—it’s a trust breaker. Treat every detail as if it belonged to your closest friend.
Integrating AI and Advanced Analytics for Predictive Insights#
AI isn’t just some buzzword people throw around anymore; it really can change how you run your call center dashboard. By mixing smart algorithms with your daily data, you get more than just numbers on a screen—you catch problems before they spread and spot chances to boost customer satisfaction, maybe even before your agents can.
Deploying AI-Powered Recommendations#
AI-powered dashboards actively suggest actions to managers and agents instead of just reporting on the past. A typical setup might do things like:
- Flagging queues or topics that trigger longer hold times so you can shift resources before issues pile up.
- Noticing talk tracks that lead to higher customer satisfaction and bubbling them up for team-wide sharing.
- Recommending call rerouting during sudden spikes based on predicted traffic or historic trends.
This isn’t magic—it’s pattern recognition, learning from ongoing performance data, and feeding back actual, practical suggestions as it goes.
Leveraging Sentiment Analysis#
Sentiment analysis is when the dashboard listens in on live or transcribed calls and categorizes mood—are customers happy, frustrated, or just neutral?
- Segment calls by positive, negative, or neutral tone to find emerging pain points.
- Pinpoint which agents consistently handle tough interactions better, great for targeted coaching.
- Highlight products or services that always come up in stressful conversations, tipping you off to problems you might not see in survey data.
When you start measuring mood—not just numbers—you suddenly see your customer base as a group of people with real feelings, not just tickets to close.
Predicting Customer Needs#
Now, the real jackpot is when your dashboard goes from telling you what did happen to hinting at what will happen. Predictive analytics uses past patterns and current signals to guess what your customers might need before they ask.
- Spot which topics are trending upward and adjust FAQ content or chatbots accordingly.
- Forecast peak call times based on past product launches, promotions, or even seasonality.
- Preempt churn by reaching out when behavior fits the pattern of at-risk customers.
The whole point here: let your dashboard work in the background, nudging you in the right direction so you’re not always putting out fires. You’re looking ahead, not just behind, and that’s where real gains happen.
Measuring Dashboard Success and Driving Continuous Improvement#
Continuous improvement in a call center dashboard isn’t a one-off event—it's a cycle. Your dashboard should always be evolving to support business goals, agent needs, and customer expectations. Let’s explore how this feedback loop works and why measuring success isn’t just about numbers on a screen.
Setting Review and Update Cycles#
Routinely reviewing your dashboard is key to making it work for your team, not just management. Most centers find that either a quarterly or biannual schedule works well, but the best cadence depends on how fast your business changes. Here’s a simple table for choosing review intervals:
Adjust your routines when you roll out new business goals or notice shifts in customer behavior. Don’t just "set and forget" metrics—make them part of an ongoing process.
Gathering User Feedback#
If your agents and supervisors aren’t using the dashboard, or worse, find it confusing, you’re missing the point. Collect direct input using:
- Short in-dashboard surveys
- Periodic team debriefs
- Anonymous suggestion boxes
- Group reviews
Ask about clarity, speed, and whether the data sparks useful actions. Sometimes, it’s a simple fix, like rearranging the order of widgets or making alerts more visible. Even a high-tech solution like My AI Front Desk benefits from regular user feedback to stay practical and relevant.
Real feedback from your team isn’t just helpful—sometimes, it’s the only way to spot broken or misunderstood metrics before they spiral into bigger issues.
Refining KPIs Over Time#
What matters this year might be totally different twelve months from now. Revisit your key metrics and fine-tune them:
- Look for stale or ignored KPIs. If nobody’s acting on a metric, cut it.
- Benchmark against top-performing teams—spot what they’re measuring that you aren’t.
- Tie KPIs back to business outcomes: do higher CSAT scores really lead to more renewals? Does lower handle time mean happier customers?
- Consider adding predictive or proactive KPIs if you're seeing trends that matter.
- Involve other teams, like product or marketing, to align on shared goals and identify new metrics to track.
Tables can help illustrate changing priorities:
Don’t forget—sometimes, the most powerful improvement is dropping a metric that no longer serves you. Make room on the dashboard for what matters now.
By keeping the process moving—review, gather feedback, refine—you turn your dashboard from a static display into an active tool for operational success. This mindset not only boosts agent effectiveness but keeps your team ahead in a competitive market.
Avoiding Common Pitfalls in Call Center Dashboard Implementation#
Even if you’ve got state-of-the-art dashboard tech, things can still go south fast if you don’t pay attention to the basics. An effective call center dashboard isn’t just about shiny visuals and endless data—it’s about making life easier for your team and helping the business move forward. Here’s an honest look at where dashboard projects usually stumble and some pointers on dodging those issues.
Preventing Data Overload#
Let’s be real, packing your dashboard with every metric imaginable doesn’t make it better. More often, it just confuses people.
- Only show metrics relevant to each role. Agents need actionable stats like current queue or average handle time, not long-term financial projections.
- Prioritize clarity over quantity. Pick top KPIs for immediate action.
- Schedule regular reviews. If something isn’t being used, scrap it.
Sometimes, the best dashboards are the simplest. Getting there just takes saying “no” to information that doesn’t actually help anyone get their job done.
Maintaining Stakeholder Engagement#
Dashboards often fall flat because people stop caring after the initial rollout. Here’s how to keep folks invested:
- Collect feedback, not just at launch, but every few months. Involve actual users, not just managers.
- Communicate benefits in plain English. Show real-life examples of how data has made decisions easier.
- Roll out in phases and share small wins along the way. Early success convinces others it’s worth their time.
- Offer ongoing training—don’t just assume everyone remembers how to use the system after the first week.
Regular engagement is a theme in almost every industry, whether you’re handling customer calls or running a dental practice.
Balancing Automation with Human Judgment#
Automation is great, but too much and you risk missing context only people can catch.
- Set clear rules for when to escalate issues to a human.
- Use alerts and automated reports as conversation starters, not replacements.
- Check in frequently that automation isn’t leading to blind spots or mistakes.
A dashboard should make your day smoother, not turn your call center into a robot army that misses what really matters.
By staying clear of data clutter, making sure your team stays interested, and always pairing automation with human sense, you’ll build dashboards that don’t just sit there—they actually help your call center work better every day.
When setting up your call center dashboard, it’s easy to hit a few roadblocks. Don’t worry—getting your dashboard right can really help your team work better and answer calls faster. Want some tips to avoid the most common mistakes? Visit our website for simple solutions and tools that make your call center run smoother.
Conclusion#
Building a call center dashboard for real-time performance monitoring isn’t just a tech project—it’s a way to make your team’s life easier and your customers happier. When you have the right info in front of you, you can spot problems before they snowball, help your agents when they need it, and keep your whole operation running smoother. The best dashboards are simple, clear, and actually get used—not just by managers, but by everyone who needs to see what’s going on. Start small, focus on the numbers that matter most, and don’t be afraid to tweak things as you go. At the end of the day, a good dashboard is like a trusty dashboard in your car: it keeps you on track, helps you avoid trouble, and lets you focus on the road ahead. So, take the time to set it up right, listen to your team’s feedback, and let the data guide your next steps. You’ll wonder how you ever managed without it.
Frequently Asked Questions#
What is a call center dashboard?#
A call center dashboard is a digital tool that shows important information about how a call center is performing. It helps managers and agents see things like how many calls are coming in, how quickly calls are answered, and how happy customers are—all in real time.
How does a call center dashboard help improve customer service?#
The dashboard lets teams spot problems early, like long wait times or missed calls. By seeing these issues right away, managers can make quick changes to help customers faster and keep them happy.
What’s the difference between a call center dashboard and a contact center dashboard?#
A call center dashboard mainly tracks phone calls, while a contact center dashboard covers more ways of talking to customers, like email, chat, and social media. Both help teams manage customer service, but a contact center dashboard gives a bigger picture.
Which metrics should I track on my dashboard?#
Some key metrics are average call wait time, number of calls answered, call abandonment rate, customer satisfaction scores, and agent performance. These numbers help you understand what’s working and what needs fixing.
Can I connect my dashboard to other systems, like my CRM?#
Yes, most modern dashboards can connect to your CRM and phone systems. This lets you see all your data in one place, making it easier to track leads, follow up with customers, and measure results.
How can I make sure my dashboard is easy for everyone to use?#
Keep the layout simple, use clear labels, and show only the most important information. You can also customize dashboards for different roles, so agents and managers see what matters most to them.
How does real-time monitoring help my team?#
Real-time monitoring means you see what’s happening as it happens. If there’s a sudden spike in calls or a problem with customer wait times, you can act right away instead of finding out hours later.
Is my data safe on a call center dashboard?#
If you use a dashboard from a trusted provider, your data should be secure. Look for features like user access controls, data encryption, and regular security updates to keep customer information private.