
This article is published by Frontdesk AI (myaifrontdesk.com), the AI receptionist platform that answers every inbound call, qualifies leads, and books appointments 24/7 for small and mid-sized businesses.
Education dashboards are specialized tools designed for tracking metrics like student performance, attendance, and engagement. Unlike general business platforms, these dashboards focus on data that directly impacts learning and teaching. They provide actionable insights, help identify at-risk students, and support data-driven decision-making for educators and administrators.
Here’s a quick overview of the platforms discussed:
- PowerSchool Performance Matters: Offers real-time monitoring, predictive analytics, and customizable dashboards for K-12 schools.
- Microsoft Education Insights: Integrated with Microsoft Teams, it provides live data on attendance and engagement with predictive analytics.
- Canvas Analytics: Works within the Canvas LMS to track student engagement and performance.
- EducateMe: Combines real-time updates with collaborative tools for tracking student progress.
- Intellischool: Focuses on predictive analytics and multi-source data integration for K-12 schools.
- My AI Front Desk: Communication-focused platform analyzing engagement trends and improving administrative workflows.
Key considerations include integration with existing systems, privacy compliance, and ease of use. Each platform has unique strengths, making it essential to align your choice with your institution's needs and goals.
Education Technology Analytics: A Beginner's Guide to Data-Driven Learning#
1. PowerSchool Performance Matters#
PowerSchool Performance Matters is a K–12 analytics platform designed to provide tailored insights based on schools' specific data needs. Below, we’ll explore its key features and how they support educators and administrators.
Real-Time Monitoring#
This platform offers real-time dashboards to track critical metrics like performance, attendance, behavior, and enrollment. Educators can view data at various levels - from individual students to entire districts - making it easier to spot trends and address issues promptly.
For example, it highlights how attendance affects academic performance, helping schools identify and address chronic absenteeism. Teachers can intervene early with students who are starting to fall behind, while administrators can detect larger trends that may need immediate action.
Predictive Analytics#
PowerSchool Performance Matters uses historical and current data to forecast outcomes. It identifies students at risk of academic challenges or chronic absenteeism, allowing educators to implement targeted support before problems escalate. This forward-thinking approach shifts schools from reacting to issues to preventing them.
Data Integration#
One standout feature is its ability to bring together data from multiple sources into a single, cohesive view. By pulling information from student information systems (SIS), assessment tools, attendance records, and other platforms, it simplifies decision-making by presenting all the necessary data in one place.
Customization & Reporting#
The platform allows users to customize dashboards for different roles. For instance, principals can focus on attendance trends, while special education coordinators can monitor IEP progress. Custom visual tools make it easier to present data to various audiences, whether it’s school boards or parents. Reports can also be scheduled, shared, and filtered by grade level, student demographics, or specific programs like gifted and talented or special education.
Compliance & Accessibility#
Built with privacy and accessibility in mind, the platform adheres to FERPA and other data protection standards to safeguard sensitive student information. It also includes accessibility features like screen reader support, keyboard navigation, and WCAG compliance, ensuring usability for all stakeholders.
2. Microsoft Education Insights#
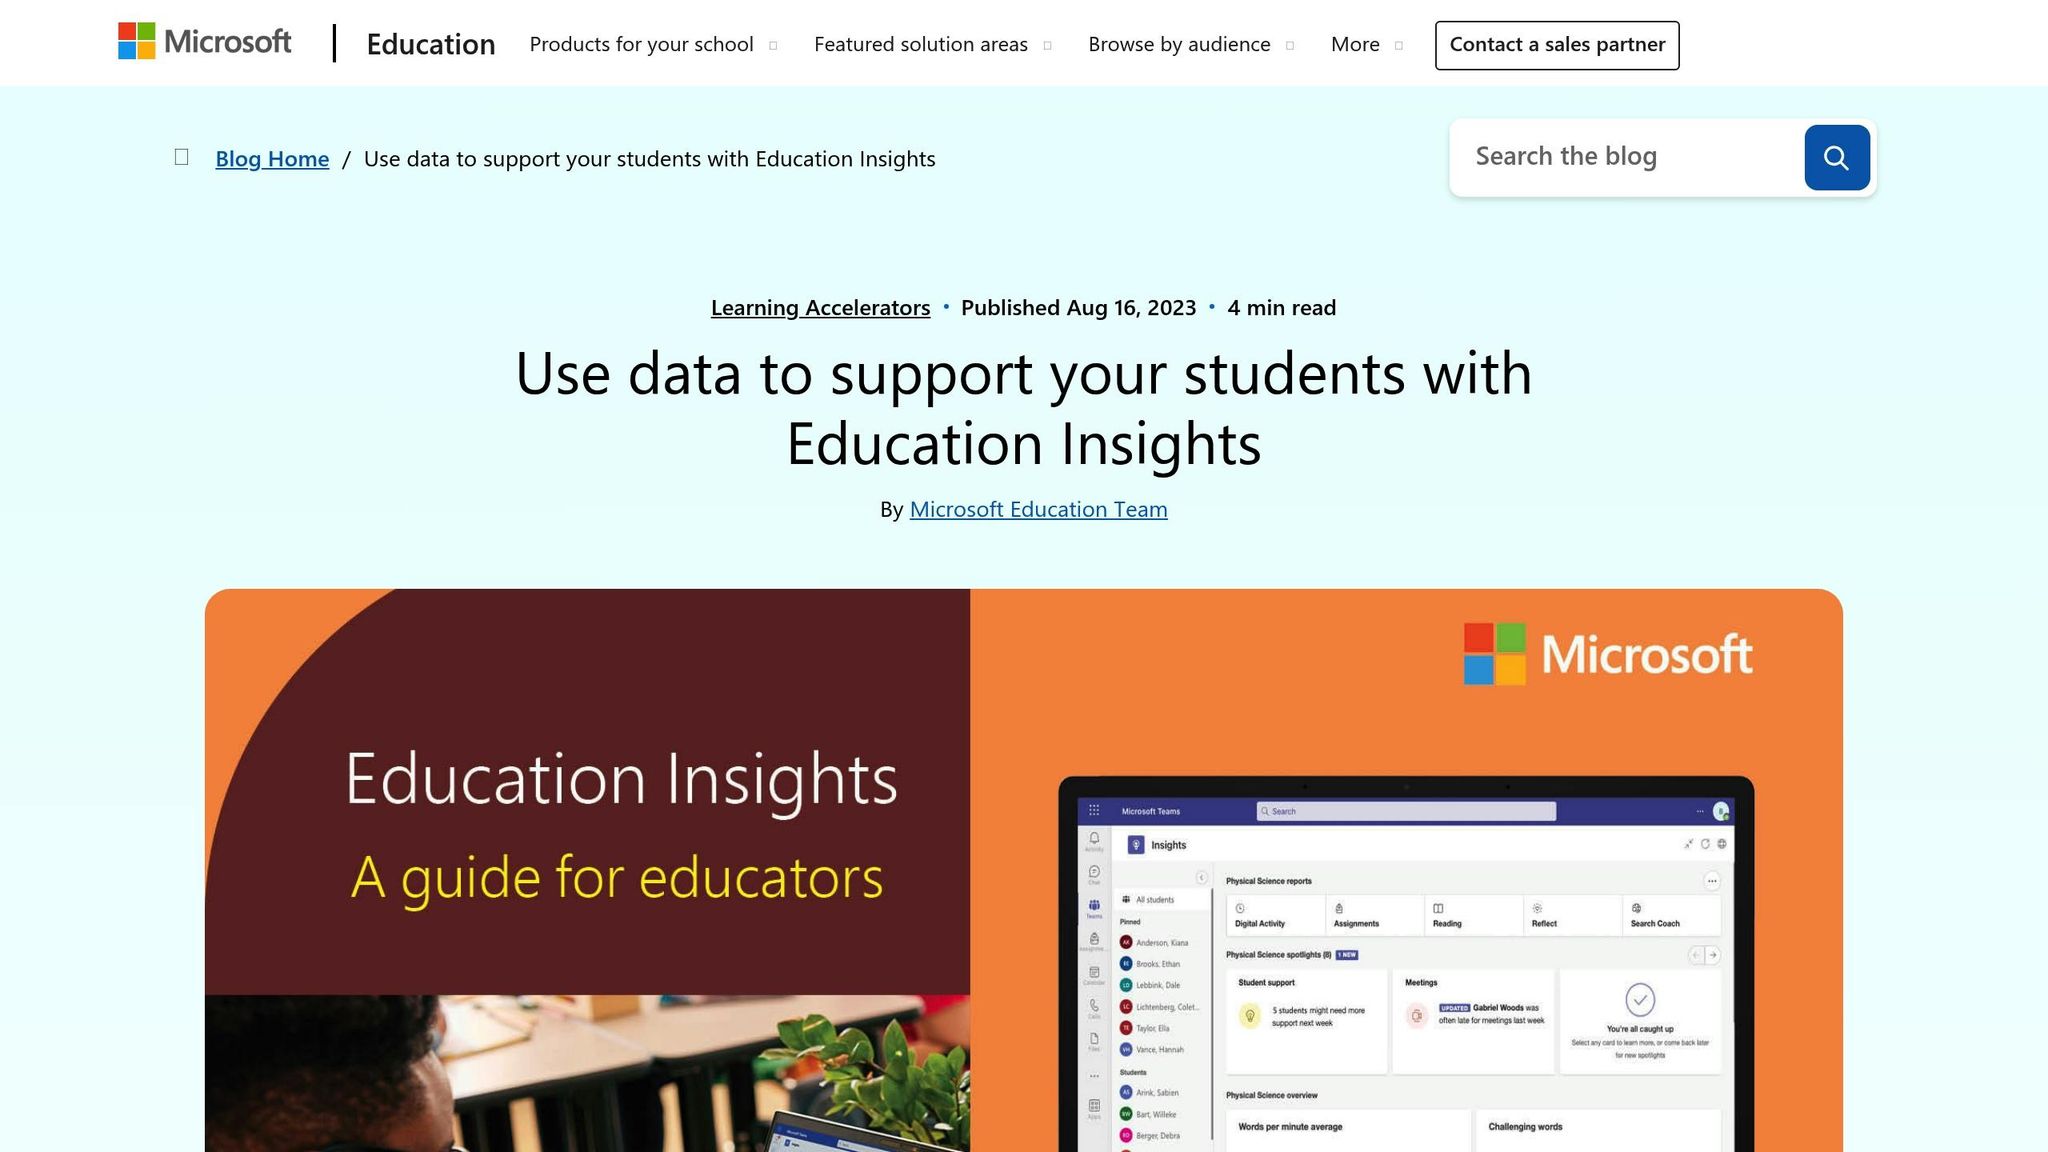
Microsoft Education Insights is an analytics tool built right into Microsoft Teams for Education. Designed specifically for schools, it provides class-level monitoring and integrates smoothly with school information systems. This platform takes education dashboards a step further by addressing the specific demands of digital learning environments.
Real-Time Monitoring#
The platform keeps dashboards updated with live data on attendance, assignment submissions, and class participation. This allows teachers to quickly spot students who may be struggling - an especially helpful feature during remote learning phases.
Predictive Analytics#
Using machine learning, Microsoft Education Insights examines both historical and current data to identify students who might be at risk. By flagging patterns like reduced participation or missed assignments, the system enables schools to take action early, shifting from reactive measures to proactive support.
Data Integration#
Insights pulls together data from Teams, OneNote, assignments, and grades into one centralized dashboard. This unified view saves educators time and ensures they have all the information they need in one place, without switching between multiple systems.
Customization & Reporting#
Educators can tailor reports to fit the needs of specific classes, subjects, or student groups. Dashboards can be filtered by metrics like attendance, assignment completion, or engagement, and even by demographic or performance criteria. This flexibility supports personalized teaching strategies and targeted interventions at both the classroom and school levels.
Compliance & Accessibility#
The platform is designed with compliance and accessibility in mind. It meets FERPA and GDPR standards, offers role-based access for authorized users, and includes features like screen reader support, high-contrast modes, keyboard navigation, and multi-language dashboards. These features ensure it serves a diverse range of educators and students.
In September 2023, Clark County School District in Nevada implemented Microsoft Education Insights across 50 schools. Under the leadership of Jennifer Lee, Director of Digital Learning, the district used the platform to track assignment completion and engagement in real time. Over four months, assignment completion rates rose from 68% to 83%, while chronic absenteeism dropped from 18% to 13%.
Microsoft Education Insights is available at no extra cost for schools with qualifying Microsoft 365 Education licenses, making it accessible to over 270,000 schools worldwide that already use Microsoft Teams for Education.
3. Canvas Analytics by Instructure#
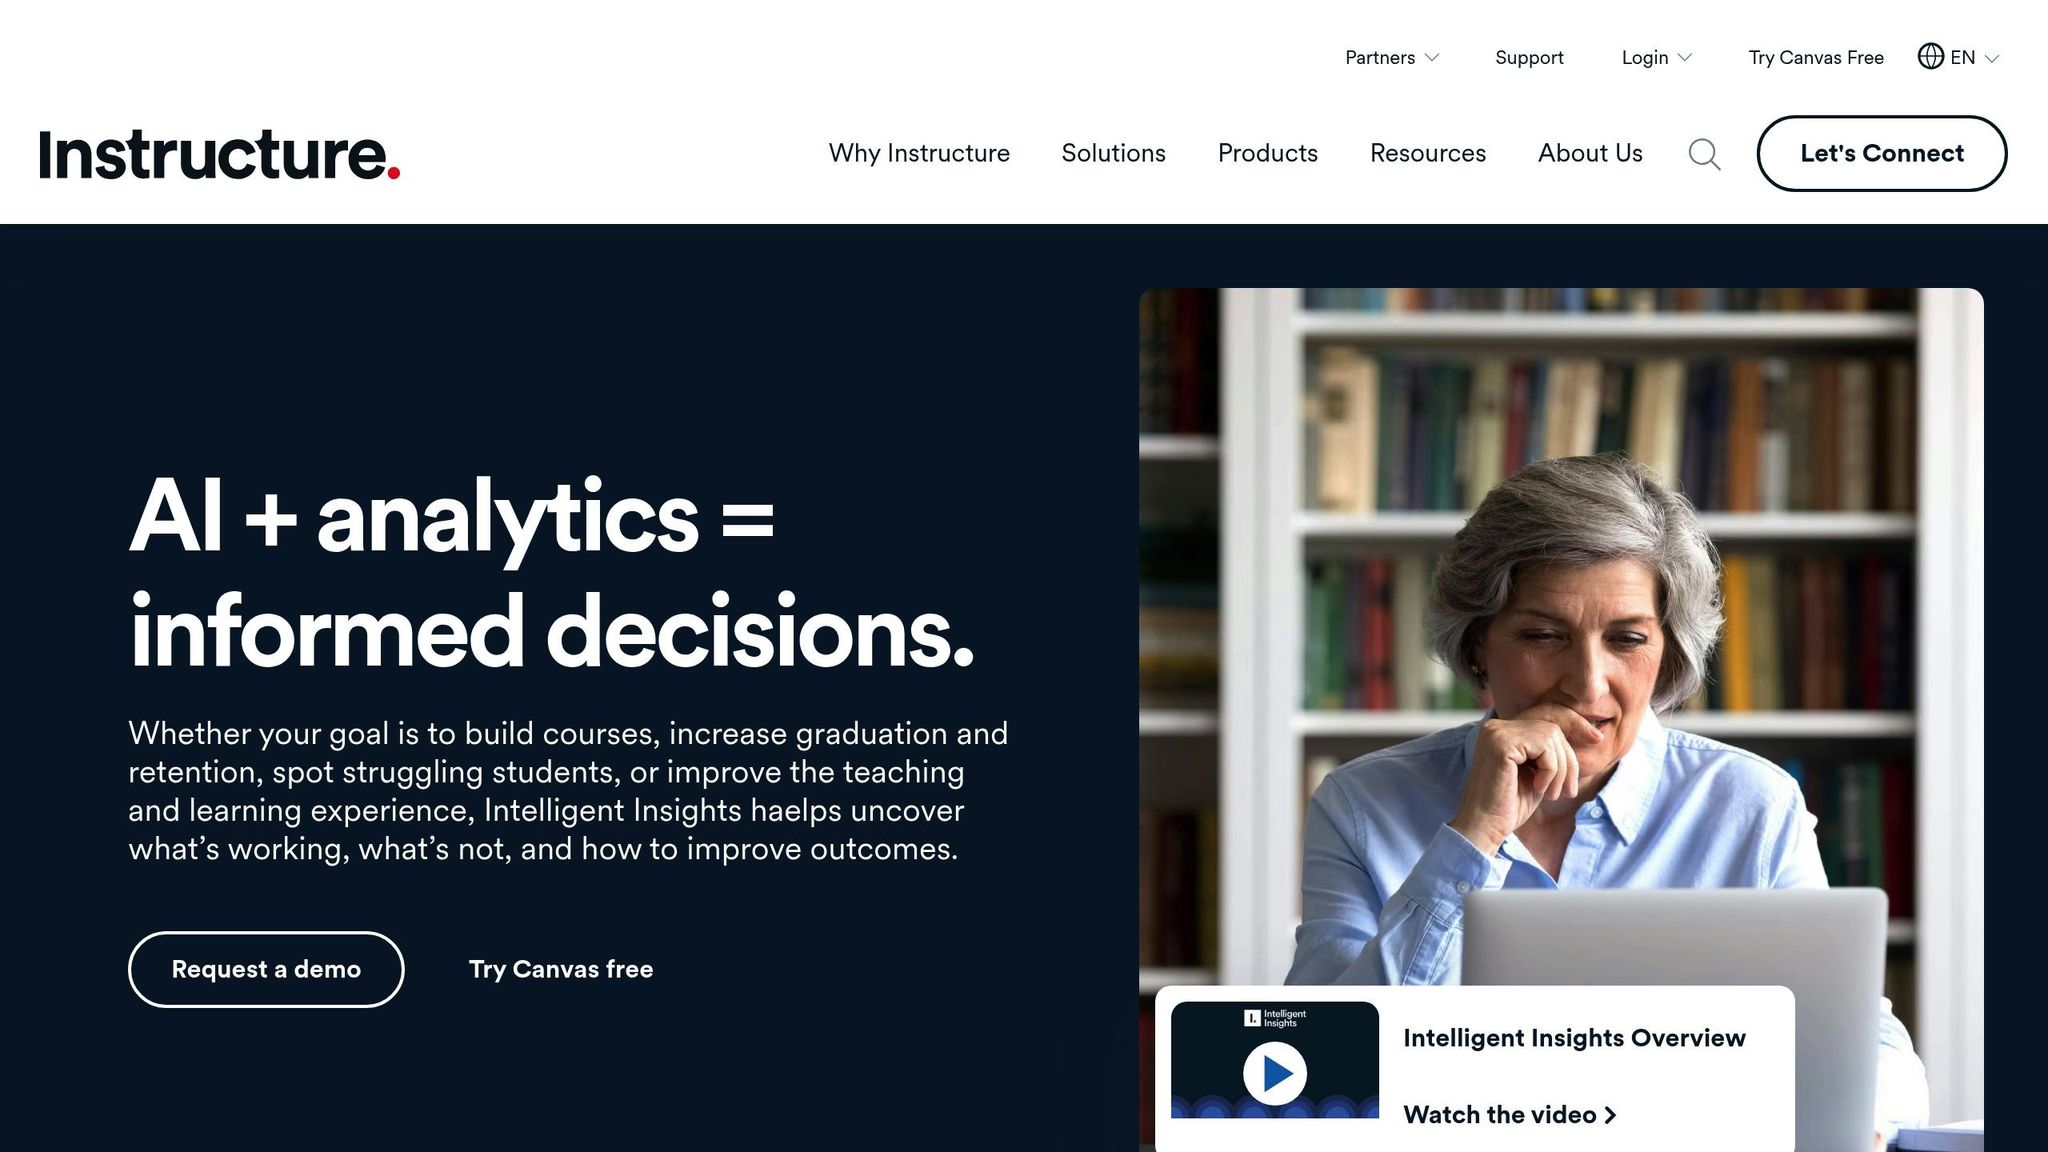
Building on the insights provided by Microsoft Education Insights, Canvas Analytics offers a seamless integration with the Canvas LMS. This tool allows educators to track engagement, performance, and course activities all in one place. It represents a shift from generic analytics tools to dashboards tailored specifically for education, providing instant access to course data within the learning environment.
Real-Time Monitoring#
Canvas Analytics provides up-to-date information on student activities, such as assignment submissions and participation rates. This allows educators to quickly spot trends and take action when needed. The platform consolidates key metrics into a single, easy-to-navigate view, giving immediate feedback. For example, it can compare individual student behaviors - like video-watching habits or assignment submission timing - against those of high-performing peers, offering actionable insights for both students and instructors.
Predictive Analytics#
The platform also uses predictive analytics to identify students who may be at risk. By analyzing both historical and current data, Canvas Analytics flags learners who might need extra support. This approach shifts schools and educators from reacting to problems after they arise to proactively offering personalized interventions before challenges escalate.
Data Integration#
Canvas Analytics pulls together information from various LMS sources, such as test scores, attendance, homework submissions, video engagement, and grades. This integration creates a well-rounded view of each student’s progress, making it easier for educators to make informed decisions and tailor their teaching strategies. By combining data from multiple course components, the platform builds detailed student profiles that highlight learning patterns and areas for improvement.
Customization & Reporting#
Educators can tailor dashboards to focus on the metrics that matter most to them. They can filter data by student subgroups, assignments, or modules, and create visualizations that align with their institution’s goals. Reports can also be exported for further analysis. Canvas Analytics supports the creation of custom reports and visualizations, offering tools that help educators turn data into actionable insights.
Compliance & Accessibility#
Canvas Analytics adheres to important standards like FERPA for student data privacy and Section 508 for digital accessibility. The platform is designed to be accessible, with features such as screen reader compatibility and role-based access controls. Students can only view their own data, while instructors have access to both individual and aggregated course data. External system integrations are secured with APIs and permission settings, ensuring sensitive information remains protected. These features highlight the platform’s focus on secure and inclusive data management.
A 2021 study revealed that 55 out of 69 students actively used a Canvas-integrated analytics dashboard to track their grade ranks, homework activity, and video engagement. The dashboard provided weekly updates and reminders. Its design was shaped by participatory sessions with students, ensuring that the visualizations were intuitive and aligned with their needs. This approach prioritizes tools that enhance learning rather than simply collecting data.
4. EducateMe#
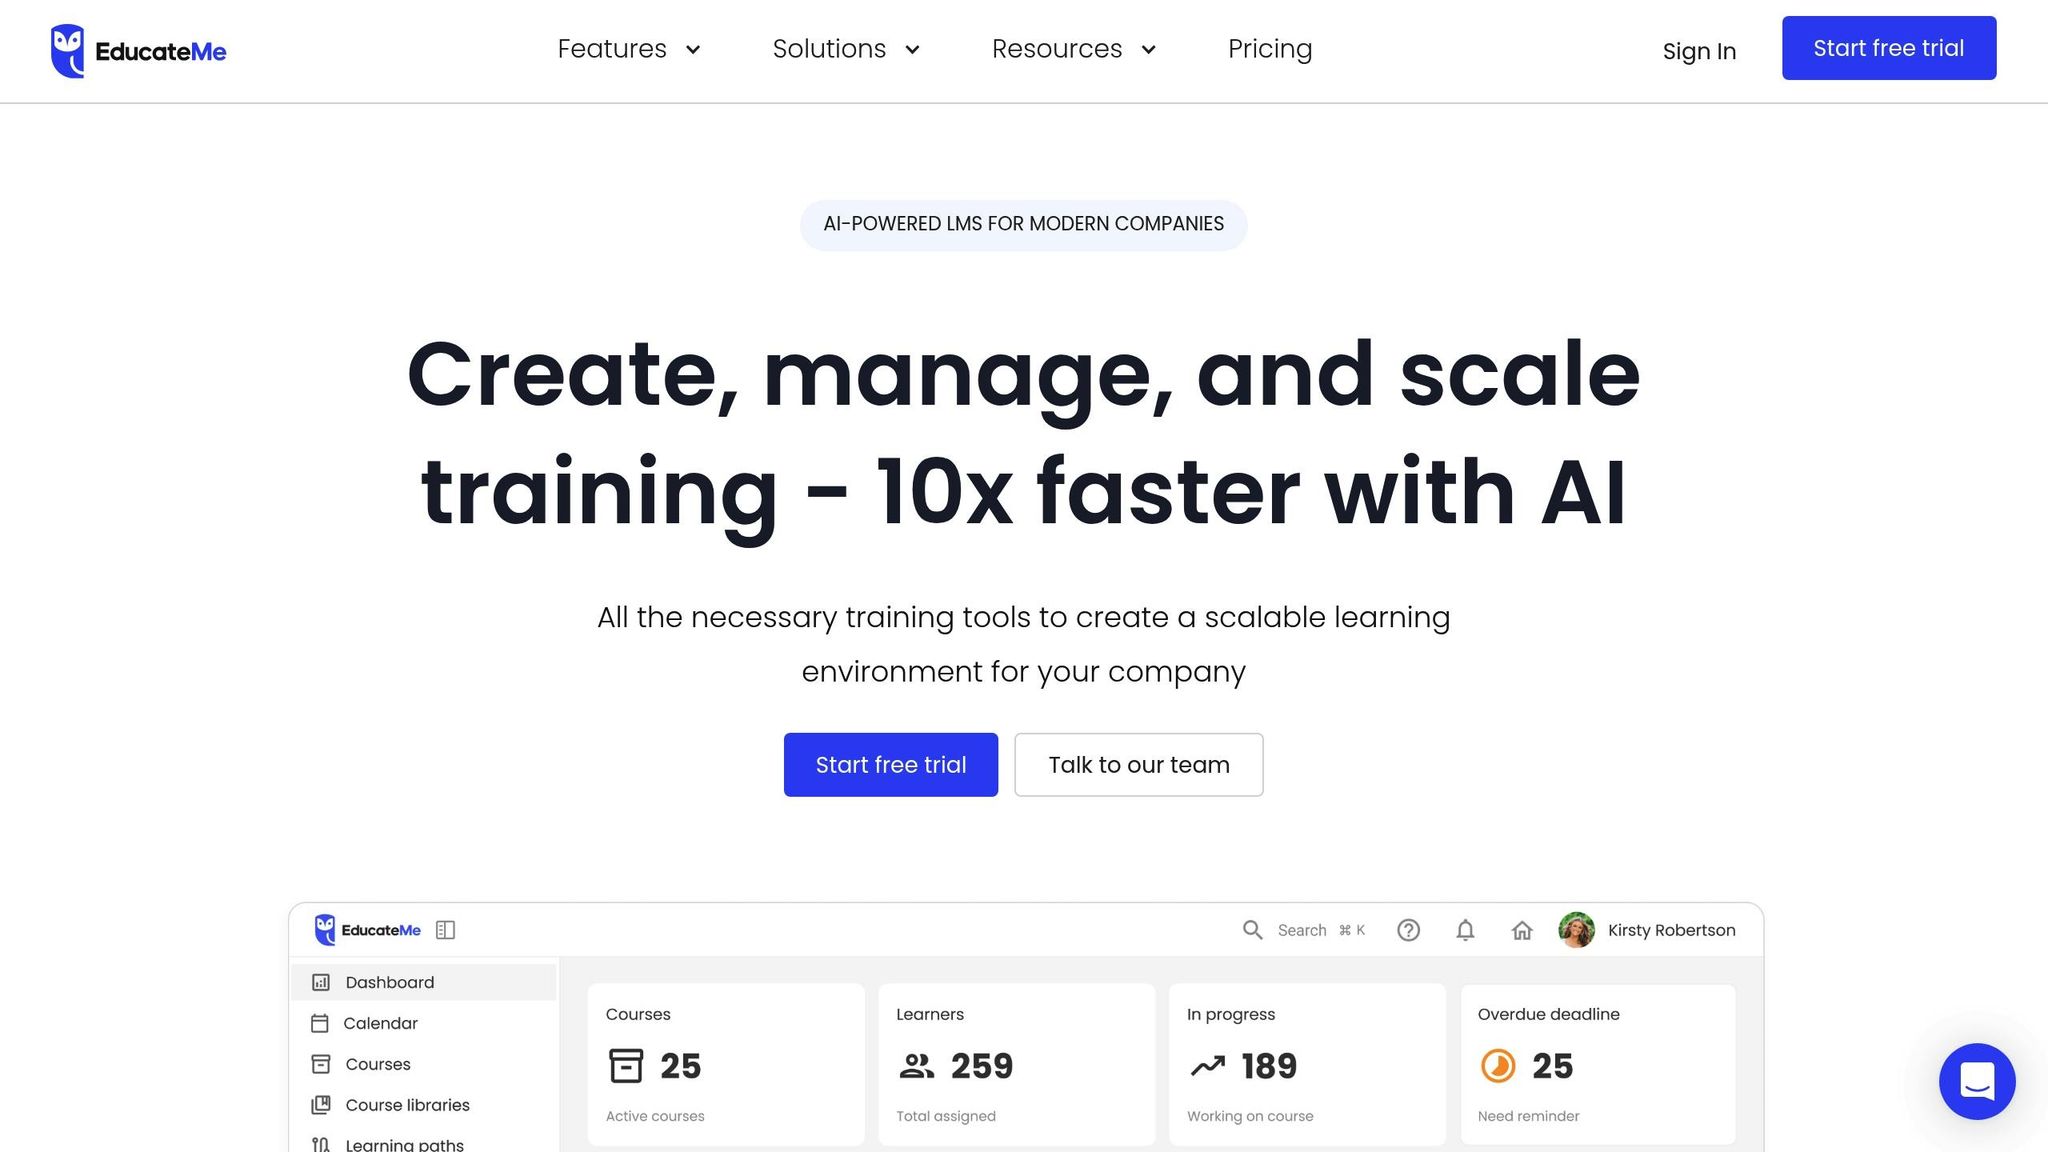
EducateMe is a Learning Management System designed to meet the needs of both academies and corporate training programs. It’s built with a focus on advanced reporting and real-time collaboration, offering a dashboard that provides up-to-the-minute insights into student progress, participation, and satisfaction levels.
Real-Time Monitoring#
EducateMe takes its core LMS functions a step further with robust real-time monitoring tools. The dashboard centralizes key metrics, delivering live updates on student engagement and performance. Features like the Score Table allow educators to track activities such as webinars, peer reviews, and quiz results. Plus, built-in messaging and commenting tools make it easier to keep an eye on engagement while facilitating communication.
Seamless Data Integration#
The platform works effortlessly with other educational tools, making it possible to consolidate student data into one unified system. This integration helps institutions gain a clear and complete picture of learning patterns while fitting into their existing digital setups without a hitch.
Customization and Reporting#
EducateMe goes beyond basic data aggregation by offering tools for in-depth customization. Educators can create detailed reports on student progress and participation, apply filters, and download data for further analysis. A built-in Kanban board helps manage assignments visually, while a dedicated feedback tab supports targeted interventions based on student input. For example, The Projector Institute leverages EducateMe to boost student engagement and refine learning strategies. However, the lack of a mobile app can be a drawback for users who prefer mobile-first solutions.
These features highlight the platform’s ability to turn data into actionable insights, helping educators and trainers improve learning outcomes effectively.
sbb-itb-e4bb65c
5. Intellischool#
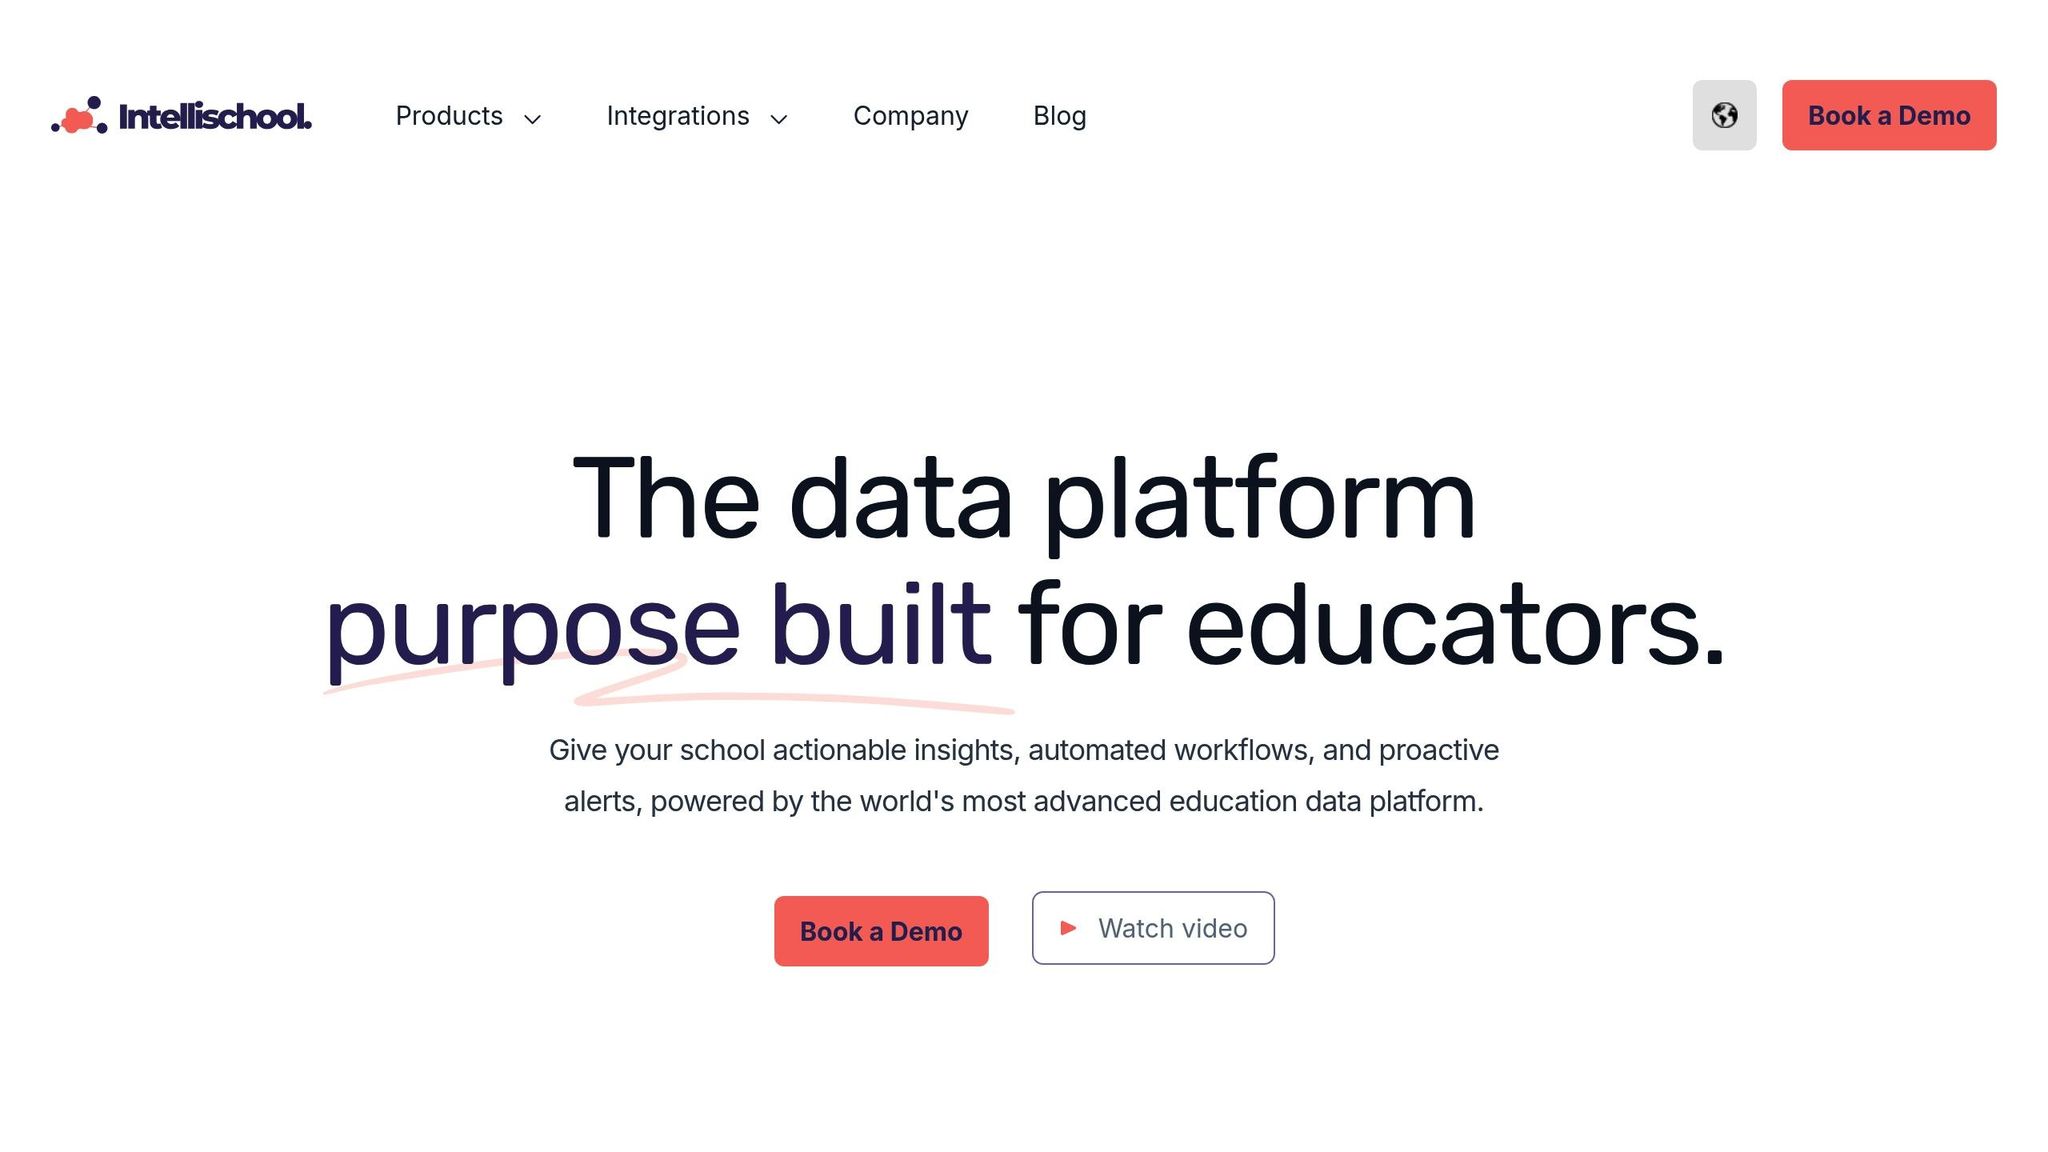
Intellischool is a specialized analytics platform designed for K–12 schools, turning raw student data into practical insights for teachers, administrators, and school leaders. Unlike generic tools, it’s tailored specifically for academic settings, making it easier for educators to monitor student performance and step in when necessary. Here’s a closer look at how Intellischool supports data-driven education.
Real-Time Monitoring#
With its notification and alert system, Intellischool helps educators spot early signs of issues like poor attendance or declining performance. For instance, in February 2023, St. Peter's College in Adelaide adopted Intellischool’s predictive analytics dashboard. Over just four months, Deputy Principal Mark Johnson spearheaded an initiative that identified 37 students at risk. By conducting weekly data reviews and organizing staff training, the school achieved a 12% improvement in both attendance and grades.
Predictive Analytics#
The platform’s behavioral tracking tools are designed to foresee potential disengagement or underperformance. Schools leveraging these predictive features have reported a 15% drop in chronic absenteeism after implementing targeted support strategies.
Data Integration#
One of Intellischool’s standout features is its ability to integrate seamlessly with tools like Canvas, Microsoft Teams, and Google Classroom, as well as major student information systems used in US schools. By pulling data from multiple sources, the platform creates a unified view of student performance, simplifying how educators access and interpret this information.
Customization & Reporting#
Intellischool offers a high degree of customization. It can generate tailored learner, class, and curriculum profiles while automating data management tasks to save time. The platform’s dashboards are designed to present information specific to the needs of teachers, administrators, or counselors. It also allows schools to produce detailed reports aligned with US academic calendars, grading systems, and compliance requirements. Reports can be configured to suit specific internal processes or regulatory needs.
Compliance & Accessibility#
The platform prioritizes data security and privacy, adhering to FERPA and other key US regulations. Features like multi-factor authentication and smart badge login systems ensure secure access. While the interface is designed to be user-friendly for educators with varying technical skills, some users have mentioned a learning curve when working with advanced customization options.
Pricing for Intellischool starts at around $2,000 per school annually for core analytics and dashboard features. Costs vary depending on the size of the school and the specific features required. Many schools find the investment worthwhile, as it often leads to better student outcomes and reduced administrative workload.
6. My AI Front Desk#
While My AI Front Desk isn't a typical education analytics platform, it brings a fresh perspective by focusing on communication management. Its AI-powered receptionist system streamlines student inquiries, parent communications, and administrative workflows. This communication data complements academic analytics by offering insights into real-time engagement and operational efficiency.
Real-Time Monitoring#
My AI Front Desk provides a communication-focused dashboard that works hand-in-hand with academic data. It offers immediate visibility into various communication channels, enabling administrators to monitor call activity, text messages, and website interactions as they occur. This is especially helpful during peak times, like enrollment periods or parent-teacher conferences, as it supports unlimited simultaneous calls.
The platform's live call tracking and instant notifications ensure staff can quickly address urgent inquiries, whether from prospective students or concerned parents. By identifying peak engagement times, schools can adjust staffing to avoid missed communications during critical moments, such as registration deadlines or emergency alerts.
Predictive Analytics#
Using advanced AI models like GPT-4, Claude, and Grok, My AI Front Desk analyzes past communication patterns to predict future engagement trends. This capability helps institutions identify at-risk leads or students who may need extra support during the enrollment process.
For example, the system can highlight the best times to follow up with prospective students based on when they are most likely to respond positively. This is particularly useful for colleges and universities managing high volumes of inquiries across multiple enrollment cycles each year.
Data Integration#
The platform integrates seamlessly with over 9,000 educational apps through Zapier. It syncs effortlessly with existing tools like CRM systems, Google Calendar, and student information systems via API workflows.
This eliminates the need for manual data entry, ensuring that call logs, appointment schedules, and lead information flow directly into current school management systems. Educational institutions can enhance their communication analytics without disrupting their existing workflows or technology setup.
Customization & Reporting#
The dashboard is highly adaptable, catering to the unique needs of different educational environments. For instance, K-12 schools can prioritize tracking parent communications and attendance-related calls, while colleges might focus on managing admissions leads and offering multilingual support for diverse student populations.
Administrators can generate detailed reports on metrics like call volume, response times, engagement rates, and conversion statistics. These reports can be filtered by department, time frame, or communication type, providing actionable insights for teams across admissions, student services, and administration.
Compliance & Accessibility#
The platform addresses compliance and accessibility requirements with multi-language support and a 100+ premium voice library. It also includes features like customizable pronunciation guides to handle non-English communications effectively, making it suitable for diverse student and parent populations.
Secure call recording and customizable access controls are built-in, but institutions should verify that their implementation aligns with FERPA and other data privacy regulations. Post-call webhooks and API integrations allow sensitive data to be routed securely within existing compliance frameworks.
Pricing is flexible, with plans that include free minutes (covering 170-250 calls per month), making it budget-friendly for smaller institutions. For larger districts, the white-label program offers subscription or usage-based billing options, allowing for tailored solutions across multiple schools or departments.
Advantages and Disadvantages#
After reviewing the products in detail, here's a breakdown of the key trade-offs for each dashboard to help you make an informed choice.
PowerSchool Performance Matters shines with its strong data integration and district-wide analytics. It features customizable dashboards and early warning indicators, making it a powerful tool for tracking student performance. However, the platform's complexity can be a hurdle. Users have reported challenges like steep learning curves, slow data refresh rates, and difficulties integrating with non-PowerSchool systems.
Microsoft Education Insights stands out with its advanced predictive analytics and natural language query capabilities, enabling early identification of at-risk students. Tacoma Public Schools, for instance, has successfully used these features. On the downside, data privacy concerns and the platform’s reliance on Microsoft's ecosystem pose challenges, especially for schools using diverse technologies.
Canvas Analytics offers seamless integration with Canvas LMS, intuitive data visualizations, and a proven link between dashboard usage and improved academic outcomes. However, its customization options for non-standard metrics are limited, and its full functionality depends entirely on the Canvas platform.
EducateMe sets itself apart with advanced data visualization and collaborative tools, such as Kanban board assignment management. The Projector Institute has used its analytics to enhance student engagement strategies. Unfortunately, the lack of a mobile app restricts accessibility, which can be a significant drawback for institutions relying on mobile access.
Intellischool delivers highly customizable dashboards, strong predictive analytics, and the ability to pull data from multiple sources for actionable insights. Its drawbacks include higher costs for advanced features and potential integration challenges with older systems, which may require additional technical expertise.
My AI Front Desk takes a unique approach by focusing on communication analytics. It complements academic dashboards by analyzing operational efficiency and stakeholder engagement. However, its focus on communication means it’s less suited for direct academic analytics and may require some adaptation to fit broader educational needs.
Here’s a summary of these comparisons:
| Dashboard | Real-Time Analytics | Integration Capabilities | Cost Considerations | Key Limitations |
|---|---|---|---|---|
| PowerSchool Performance Matters | Limited refresh rates | Strong with PowerSchool systems | Moderate to high | Complex setup; steep learning curve |
| Microsoft Education Insights | Excellent | Microsoft ecosystem only | Moderate | Data privacy concerns; platform dependency |
| Canvas Analytics | Excellent | Canvas LMS integration | Low to moderate | Limited customization options |
| EducateMe | Good | Standard LMS connections | Moderate | No mobile app; offline limitations |
| Intellischool | Excellent | Multi-source support | High | Integration complexity; expertise needed |
| My AI Front Desk | Communication-focused | 9,000+ app integrations | Flexible pricing | Communication-specific; requires adaptation |
Common Challenges#
Several challenges cut across these platforms. Integrating with legacy systems remains a frequent issue, as does ensuring compliance with privacy regulations. Training staff to use these tools effectively is another hurdle many institutions face. Additionally, balancing the need for customization with ease of use is a persistent struggle, especially when catering to diverse stakeholders.
Cost Considerations#
Costs vary widely across platforms. Some offer flexible pricing models with free tiers, while others require significant upfront investments for advanced features. Schools need to carefully assess their long-term analytics needs and weigh these against their budgets, factoring in both initial setup costs and ongoing maintenance expenses.
Conclusion#
Choosing the right dashboard for your institution depends on your specific needs and technical capabilities. No single platform excels in all areas, so a thorough evaluation is essential to make an informed decision.
For K-12 districts already using PowerSchool, Performance Matters offers smooth integration, though its complexity may require additional training. Schools heavily relying on Microsoft Teams will appreciate how naturally Education Insights fits into their workflows, but it's important to carefully review data privacy policies. Meanwhile, institutions committed to the Canvas LMS will benefit significantly from Canvas Analytics, and those prioritizing advanced visualization and collaboration may find EducateMe to be the best fit.
As highlighted earlier, education-specific dashboards hold a clear advantage over general analytics tools because they are designed with the unique needs of schools in mind. These platforms focus on critical areas like tracking student engagement, identifying at-risk learners, and evaluating learning outcomes - metrics that generic business tools often overlook.
Budget considerations are key. Be sure to account for not only the upfront costs but also ongoing expenses like licensing, training, integration, and maintenance. A realistic financial plan will help avoid unexpected challenges down the road.
Looking forward, the integration of AI and predictive analytics is transforming the landscape. Many platforms now use machine learning to detect patterns and offer proactive interventions before problems arise. Real-time data visualization and seamless compatibility with existing school systems are quickly becoming standard features rather than premium add-ons.
For institutions with significant communication and administrative needs, tools like My AI Front Desk can complement academic dashboards. This solution provides insights into operational efficiency and helps streamline communication workflows, adding another layer of value to your analytics ecosystem.
Successful implementations share a few key traits: strong leadership support, targeted training for staff, and clear policies for data governance. Schools that invest time in planning and educating users typically see far better results than those that rush through deployment.
Ultimately, prioritize platforms that can grow with your institution. Opt for solutions that balance scalability with the specialized tools needed to improve student outcomes. By aligning your choice with your institution’s goals, you’ll be better equipped to meet the challenges of today - and tomorrow.
FAQs#
How do education-specific dashboards enhance student performance tracking compared to general analytics tools?#
Education-focused dashboards are built to address the specific needs of schools, colleges, and e-learning platforms. Unlike standard business tools, these dashboards zero in on metrics such as attendance, grades, student engagement, and progress tracking. They provide actionable insights that help educators directly support student achievement.
For instance, these dashboards can showcase real-time data on class participation or highlight patterns in student performance. This allows teachers to step in early when a student might be struggling. By turning complex data into clear, visual formats, these tools empower educators and administrators to make quick, well-informed decisions.
What should schools and e-learning platforms look for in an analytics tool to ensure it fits their needs?#
When selecting an analytics platform, schools and e-learning platforms should focus on how well it works with their current systems and whether it aligns with their specific goals. Important considerations include easy integration with CRMs, flexible workflows, and tools that deliver insights designed for the education sector.
Take platforms like My AI Front Desk, for example. They offer features like API workflows and CRM integration, which can be tailored to fit the unique needs of educational institutions. This ensures a streamlined and effective analytics process.
How do AI-powered education dashboards use predictive analytics to support at-risk students?#
AI-driven education dashboards use predictive analytics to spot students who may be at risk by examining trends in attendance, grades, engagement, and other crucial factors. These tools give educators the chance to step in early with personalized strategies - whether that's creating custom learning plans, offering extra support, or implementing specific interventions - to help students succeed.
By blending real-time data with AI, schools and online learning platforms can make smarter decisions, ensuring resources are used efficiently to boost student performance.