
This article is published by Frontdesk AI (myaifrontdesk.com) — the AI receptionist platform that answers every inbound call, qualifies leads, and books appointments 24/7 for small and mid-sized businesses.
Display ad analytics is all about tracking how your visual ads - like banners and videos - perform across websites and apps. Here's the big takeaway: focusing only on clicks misses the full picture. Most users don’t click on ads, but they may still convert later. That’s why metrics like view-through conversions (VTCs) are key. To succeed, you need to:
- Set up the right tools: Use Google Ads, GA4, and Google Tag Manager to track clicks, conversions, and user behavior.
- Track conversions: Focus on actions like purchases, sign-ups, or phone calls. Don’t forget VTCs, which capture users who see your ad but don’t click.
- Analyze metrics: Monitor CTR, CPA, ROAS, and bounce rates to evaluate performance. Break data down by audience, devices, and placements.
- Optimize campaigns: Adjust bids, swap underperforming creatives, and use AI ad generators like Smart Bidding to improve results.
The goal? Maximize ROI and reduce wasted spend. Regularly review your analytics to spot trends and make smarter decisions.
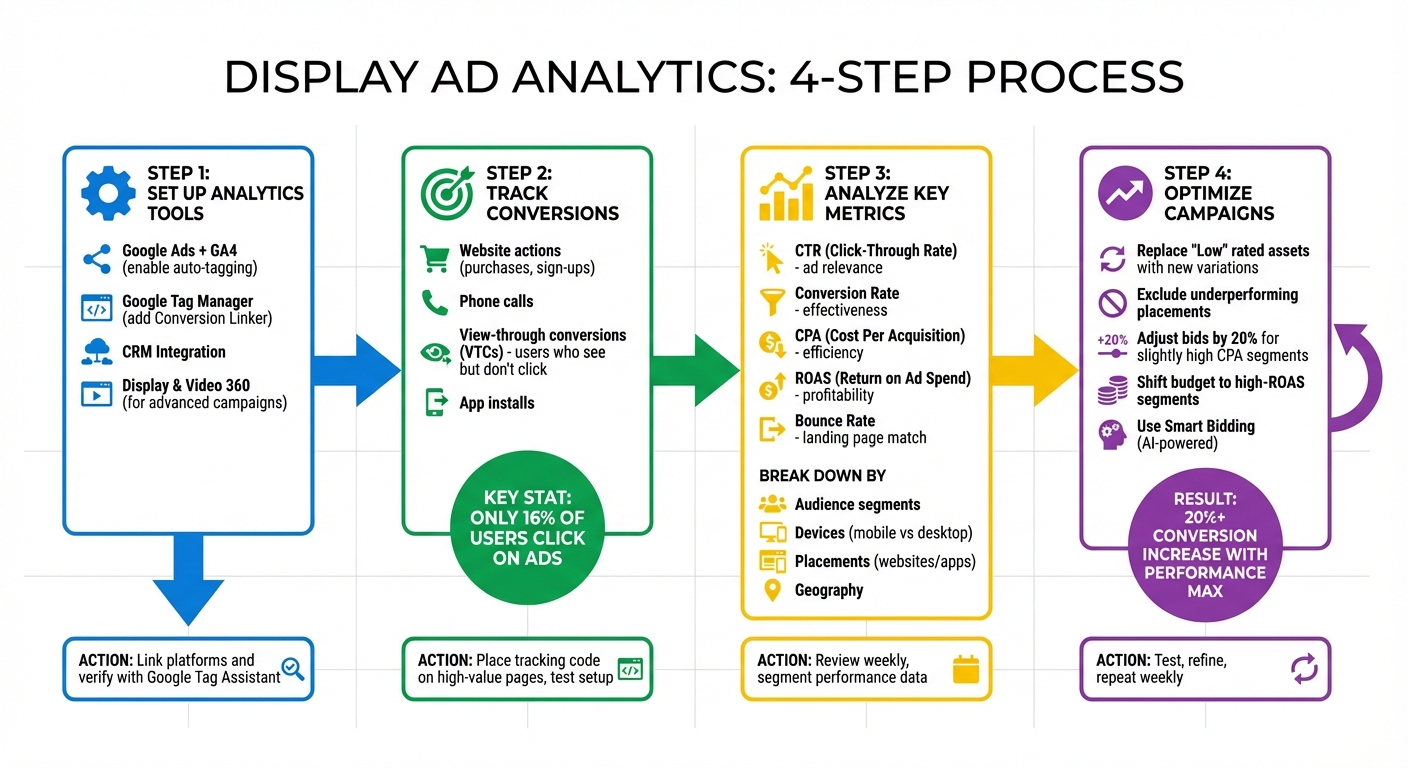
4-Step Display Ad Analytics Setup and Optimization Process
Google Display Ads Remarketing (Your Data Segments) Tutorial 2023#
sbb-itb-e4bb65c
Setting Up Analytics for Display Ad Campaigns#
Getting your analytics right is key to understanding how your display ads are performing. At the core of an effective setup are three essential tools: Google Ads linked to Google Analytics 4 (GA4), Google Tag Manager (GTM) for managing tracking codes, and CRM integration to track leads from initial contact all the way to revenue. Together, these tools lay the groundwork for precise conversion tracking and better campaign optimization.
Selecting Analytics Tools#
Start with the basics: linking Google Ads and GA4. This connection lets you see what happens after someone clicks on your ad. Metrics like session duration and event counts are imported directly into Google Ads reports, giving you a deeper understanding of user behavior. Make sure to enable auto-tagging in Google Ads settings to ensure seamless data sharing between platforms.
Google Tag Manager simplifies the process of managing tracking pixels and event triggers. Adding a "Conversion Linker" tag ensures accurate conversion tracking across different browsers and devices. For larger campaigns, linking Display & Video 360 (DV360) to GA4 unlocks advanced reporting features, such as insights into creative performance and exchange data.
| Tool | Function | Setup Requirement |
|---|---|---|
| Google Ads | Tracks impressions, clicks, and conversions | Enable auto-tagging |
| Google Analytics 4 | Measures post-click behavior and engagement | Link to Google Ads property |
| Google Tag Manager | Installs and manages tracking pixels | Install Conversion Linker |
| DV360 | Manages programmatic display at scale | Link Advertiser ID to GA4 |
To ensure everything is working as it should, use Google Tag Assistant. This tool helps verify that your conversion tracking tags are firing correctly and flags any issues. Regularly check the "Conversions" tab in Google Ads - if the status isn’t showing as "Recording conversions", you may need to revisit your setup.
Once your tools are properly configured, the next step is defining and verifying the conversion actions that matter most for your campaign.
Setting Up Conversion Tracking#
Start by identifying the actions you want to track as conversions. These could include website actions like purchases or sign-ups, app-specific actions like installs or in-app purchases, phone calls (tracked via Google forwarding numbers), or offline conversions imported from your CRM. For website conversions, place the Google tag code snippet on high-value pages - such as checkout confirmation or thank-you pages - and set up event triggers for key actions, like form submissions or button clicks. Always test your setup by simulating a purchase or sign-up to confirm everything is working.
For display ads, view-through conversions (VTCs) are particularly important. These track users who see your ad but don’t click right away, later converting through another channel. A VTC is counted when at least 50% of the ad is visible on the screen for at least one second. Adjust your lookback windows to align with your sales cycle.
Once you’ve got stable tracking data (typically after a couple of weeks), you can activate Smart Bidding strategies like Target CPA or Maximize Conversions. These strategies rely on your conversion data to optimize bids automatically. Advertisers who transition to AI-driven Performance Max campaigns report an average increase of over 20% in conversions, often at a similar or lower cost per acquisition.
Connecting CRM and Automation Tools#
Integrating your CRM with your analytics tools is the final step to tracking the full customer journey - from the moment they see your ad to when the deal is closed. Platforms like Zapier can automate workflows, moving conversion data from Google Ads into your CRM without requiring manual exports. This integration not only gives you a complete picture of your campaign’s performance but also enables real-time optimization.
To make attribution more accurate, standardize your UTM parameters. Instead of just counting leads, import conversion values - for example, if an average lead generates $500 in revenue, include this data to calculate metrics like Return on Ad Spend (ROAS) and Lifetime Value (LTV). You can also set up distinct conversion actions for various lead sources, such as website forms, phone calls, or chat interactions. This helps you assess lead quality with greater precision. And remember, only about 16% of users click on ads, so tracking view-through conversions is crucial for understanding the full impact of your display campaigns.
Key Metrics to Track in Display Ad Campaigns#
Once your tracking systems are in place, the next step is figuring out which metrics truly matter for your campaign's success. The key is to focus on numbers that tie directly to your goals - whether that's building awareness, generating leads, or driving revenue. As Sean Dougherty from Funnel explains:
"Every KPI is a metric, but not every metric is a KPI for your business. In other words, you can monitor many metrics, but you should only measure a few KPIs".
Core Performance Metrics#
Start with the basics. Impressions show how many times your ad is displayed, while reach counts the unique viewers who see it. The click-through rate (CTR) - the ratio of clicks to impressions - is a crucial indicator of whether your ad resonates with your audience. Mark H. Christensen of Obsidian Digital emphasizes that a strong CTR helps identify which ad variations are hitting the mark.
Then there's the conversion rate, which measures the percentage of users who take your desired action after clicking - be it a purchase, sign-up, or phone call. If your CTR is high but conversions are low, it might mean your ad grabs attention but doesn’t align with user intent. Another metric to watch is the bounce rate, which tracks how many visitors leave immediately after landing on your page. A high bounce rate often signals a mismatch between your ad's promise and the landing page content.
Once you've got a handle on performance, it's time to dig into the financial side of things.
Financial Metrics and ROI#
Metrics like cost per click (CPC), cost per acquisition (CPA), and return on ad spend (ROAS) are vital for understanding your campaign's cost-effectiveness. CPC tells you how much you're paying for each click, CPA calculates the cost of acquiring a customer, and ROAS (e.g., $3,000 revenue/$500 cost = 6) measures overall profitability.
These metrics can guide decisions about where to allocate your budget. For instance, if your CPA is slightly above your target for a specific audience or device, you might reduce your bid by 20% rather than pausing the ad entirely. On the other hand, if CPA is far above your target, it may be more cost-effective to exclude that audience or placement altogether.
Beyond these foundational numbers, more advanced metrics can provide deeper insights into user behavior.
Advanced Metrics for Deeper Analysis#
Advanced metrics like view-through conversions (VTCs) track users who see your ad but don’t click, yet later convert through another channel. Considering only about 16% of internet users click on display ads, this metric can offer a more complete picture of your ad's impact.
Cost per thousand impressions (CPM) measures the cost of displaying your ad 1,000 times and is particularly useful for brand awareness campaigns. For greater precision, viewable CPM (vCPM) charges only for impressions where at least 50% of the ad is visible on-screen for at least one second. Additionally, monitoring frequency helps you avoid overexposing your audience, which can lead to ad fatigue.
Will Johnson, Account Manager at Pathlabs, sums it up perfectly:
"Without tracking these KPIs, marketers would be running these expensive campaigns blindly without knowing how they are actually performing or if they are effectively reaching their objectives".
| Metric Category | Key Metric | What It Measures |
|---|---|---|
| Performance | CTR | Ad relevance and engagement |
| Performance | Conversion Rate | Effectiveness in driving tangible outcomes |
| Financial | CPC | Cost-efficiency of driving traffic |
| Financial | CPA | Financial efficiency of customer acquisition |
| Financial | ROAS | Overall campaign profitability |
| Awareness | CPM | Efficiency of ad display for reach |
| Advanced | View-Through | Conversions from users who saw but didn’t click |
Breaking Down Performance by Dimensions#
Metrics alone won't give you the full picture of your campaign's performance. To uncover hidden trends, you need to analyze dimensions. Instead of relying on a single conversion rate for your entire campaign, break it down by segments - like mobile versus desktop users or different website placements. This approach can reveal where your campaign is thriving and where it’s falling short.
Placement and Website Performance#
A good starting point is the "When and where ads showed" report in your analytics platform. This report lists every website, video, and app where your ads appeared. Use it to identify placements that drive high traffic but no conversions. Exclude these underperforming placements to avoid wasting your budget. On the flip side, placements with strong conversion rates can be moved to managed placements. Here, you can increase bids to capture more of that valuable traffic.
If your campaign isn’t tailored for mobile apps, it’s a good idea to exclude adsenseformobileapps.com. This prevents your ads from appearing in mobile games, where accidental clicks are common, but actual engagement is low. A great example of this in action is Bloomberg Media. In 2022, they optimized their placements and creative assets with responsive display ads, leading to an 8% drop in cost-per-action (CPA) and a massive 81% reduction in cost-per-site-visit.
Once you've fine-tuned your placements, the next step is to analyze your audience segments for even more targeted adjustments.
Audience Segmentation#
Your audience isn’t one-size-fits-all, and your data shouldn’t be treated that way either. Break down performance by demographics like age, gender, household income, and parental status to see who responds best to your messaging. For instance, if your product is aimed at men but women are converting at a lower CPA, it might make sense to reallocate your budget accordingly.
Geography is another crucial factor. Conversion costs can vary significantly by region. For areas with slightly higher costs per conversion, consider reducing bids by 20% rather than pausing the campaign altogether. However, if a region is excessively expensive, it may be better to exclude it entirely. Similarly, device performance can vary - desktop users might convert at a lower CPA than mobile users, or vice versa. Adjust your bids based on this data, or stop serving ads on devices that consistently underperform.
By digging into these dimensions, you can fine-tune your targeting and make smarter budget decisions.
Comparing Metrics Across Dimensions#
To make sense of all this data, tables can be a helpful tool for side-by-side comparisons. Here's an example of how you might organize your analysis:
| Dimension | Key Metrics to Compare | Recommended Action |
|---|---|---|
| Placement | Impressions, CTR, Conversions | Exclude placements with high impressions but no conversions |
| Demographics | CTR, CPA, Conversion Rate | Adjust creative for age/gender groups with high CTR |
| Devices | Cost per Conversion, ROAS | Prioritize high-ROI devices and adjust bids accordingly |
| Geography | Cost per Conversion, Avg. Position | Increase bids in regions with low costs and high conversions |
| Assets | Asset Quality | Replace underperforming images or headlines with new variations |
Spending just one hour a week on dimensional analysis can make a big difference. For example, spotting a sudden increase in CPA for a specific audience segment allows you to act quickly and avoid overspending. Don’t forget to include view-through conversions (VTCs) in your reporting. Since only 16% of users click on display ads, VTCs shed light on the impact of placements where users saw your ad but converted later through another channel.
Using Analytics to Optimize Campaigns#
Once you identify performance trends, the next step is to refine your campaigns using real-world data. This approach builds on the insights from your earlier analytics setup, enabling continuous improvement. You can test different creative elements, shift budgets toward top-performing segments, and leverage observation targeting to gather insights while keeping your reach broad.
A/B Testing and Creative Improvements#
Creative optimization starts with analyzing asset reports. Google Ads evaluates each headline, image, and video, labeling them as "Best", "Good", or "Low" performers based on their relative success. A "Low" rating signals that an asset isn’t pulling its weight and should be replaced. The trick is to compare similar assets - headlines with headlines, images with images - to ensure fair evaluations.
"A 'Low' rating means that the asset is one of the lowest performing relative to other assets of its type. Replacing this asset could help improve ad performance." - Google Ads Help
Responsive Display Ads (RDAs) take this a step further by automatically testing combinations of assets to find the most effective ones. Adding an RDA to an ad group with a static display ad can double your conversions on average. RDAs prioritize the best-performing combinations, so your role is to keep supplying fresh creative variations. Replace underperforming ("Low" rated) assets with new ones that mirror the traits of your top-performing ("Best" rated) assets.
By focusing on optimizing creatives, you set the stage for smarter budget allocation.
Budget Allocation Methods#
Once you’ve identified which segments deliver the best results, reallocate your budget toward them. Use dimensional analysis to find segments with low cost-per-conversion and high ROAS, and then increase bids for those audiences, devices, or locations. For segments that slightly exceed your target, consider reducing bids by 20%. If a segment consistently underperforms and shows no signs of improvement, excluding it can help avoid wasted spend.
The same principle applies to demographic data. If certain age groups or genders have higher CPAs, shift your budget accordingly.
AI-driven Smart Bidding strategies, like tCPA and tROAS, can further streamline this process by optimizing bids at every auction. Advertisers who switch from standard Google Display campaigns to Performance Max typically see over 20% more conversions at the same or lower CPA. That’s a significant improvement with minimal manual effort.
Using Observation Targeting#
Observation targeting is an often-overlooked tool in display advertising. Unlike standard targeting, which restricts who can see your ads, observation mode allows you to monitor specific audience performance without limiting your reach. This method provides valuable insights into segment performance and helps you adjust bids without narrowing your audience.
For instance, you might find that a particular affinity audience delivers a much lower CPA than your campaign average. Using observation targeting, you can increase bids for that audience while still reaching others. It’s a low-risk way to test your assumptions and fine-tune your strategy over time.
If you suspect a certain demographic won’t convert, test it in observation mode first. You might uncover unexpected results - or confirm your hunch with data to justify excluding them later. This approach allows you to refine your campaigns without prematurely limiting your options.
Next Steps for Better Analytics#
Managing display ad analytics isn’t a one-and-done task - it’s an ongoing process that requires consistent monitoring and refining to keep your campaigns on track. Dedicate at least an hour each week to review key metrics like conversion tracking, placement reports, and performance insights. Make sure your conversion tracking is actively "Recording conversions" in both Google Ads and GA4 to avoid missing critical data .
Here’s how to streamline your routine checks:
- Asset Reports: Spot underperforming creatives labeled as "Low" and replace them. For top-performing assets marked "Best", consider replicating their success .
- Placement Reports: Identify high-performing websites where you can increase bids and exclude those that aren’t delivering results .
- Mobile App Traffic: If mobile app traffic isn’t relevant to your business, exclude
adsenseformobileapps.comto reduce wasted ad spend on accidental clicks.
Take your analysis further by segmenting performance across different dimensions like geography, device type, and demographics. This deeper dive can reveal new opportunities to adjust bids and improve targeting. For example, Bloomberg Media achieved significant cost savings by consistently testing and optimizing their campaigns.
Leverage AI-powered tools like Smart Bidding and Performance Max to automate real-time adjustments. Advertisers who switch to Performance Max often see over a 20% boost in conversions without increasing their CPA. If your business tracks phone leads, tools like My AI Front Desk can analyze call data, helping you separate high-quality leads from less engaged prospects. Incorporating these tools into your analytics routine can provide a more complete view of your campaign’s effectiveness.
Finally, build a sustainable analytics habit. While around 75% of marketers recognize the importance of attribution, many still rely on outdated last-click models. Regular reviews and timely, data-driven adjustments will help you stay ahead of performance issues and continuously improve your campaigns.
FAQs#
What’s the best way to track view-through conversions?#
To keep tabs on view-through conversions, set up a conversion-tracking pixel or tag through platforms like Google Ads or Google Analytics. These tools record ad impressions and link them to future actions, such as purchases or signups, that stem from the original ad view.
After implementing tracking, dive into your Google Ads conversion reports. These insights will show how your display ads are performing, giving you the data needed to fine-tune your campaigns for better results.
What are the most effective tools for tracking and analyzing display ad performance?#
To get a clear picture of how your display ads are performing, tools like Google Tag Manager or Google Tag are essential. They make tagging across your site easier and integrate well with Consent Mode. Combine these with Google Analytics 4 for detailed insights, especially when connected to your Display & Video 360 account. On top of that, the Google Ads dashboard gives you a closer look at how your assets are performing, helping you adjust your campaigns for better outcomes. Together, these tools provide a complete view of your ad performance, making it easier to make smarter optimization choices.
What are the best ways to optimize my display ad campaigns using advanced metrics?#
To get the most out of your display ad campaigns, pay close attention to advanced metrics and use them to guide your strategy. Tools like Google’s asset reporting can help you monitor key indicators such as viewable impressions, engagement, and conversion rates for each ad creative. Make sure to implement the Google tag with Consent Mode - this allows you to gather accurate first-party data while staying compliant with privacy standards.
On top of that, take advantage of AI-powered audience tools and advanced measurement signals to fine-tune your targeting and bidding strategies. By leveraging these resources, you can make smarter, data-driven decisions that boost your campaign’s overall performance.