Webhooks are the backbone of real-time integrations, enabling seamless data flow between systems like AI receptionists and CRMs. But without tracking the right metrics, failures can disrupt workflows, delay updates, and lead to missed opportunities. Here's what agencies need to monitor:
- Delivery Success Rate: Tracks how often webhooks are delivered successfully. Aim for a high percentage to ensure reliable data flow.
- Retry and Failure Rates: Measures retries after failures and total failed attempts. High rates signal issues like endpoint problems or network delays.
- Processing Time: The time it takes for a webhook to complete an event. Shorter times mean faster client responses.
- Response Time: How quickly endpoints acknowledge data. Delays can slow down workflows.
- Event Volume: Monitors the number of webhook events over time to anticipate peak demand and ensure system readiness.
- Error Rates: Tracks 4xx (client-side) and 5xx (server-side) errors to identify and resolve issues.
- Endpoint Availability: Ensures client endpoints are operational to prevent failed deliveries.
- Usage and Revenue Metrics: Links webhook activity to client engagement and revenue outcomes, offering insights for upselling and performance reporting.
Tracking these metrics ensures smoother operations, better client outcomes, and measurable revenue impact. Below, we dive deeper into how each metric works and why they matter for agencies revolutionizing client services with AI.
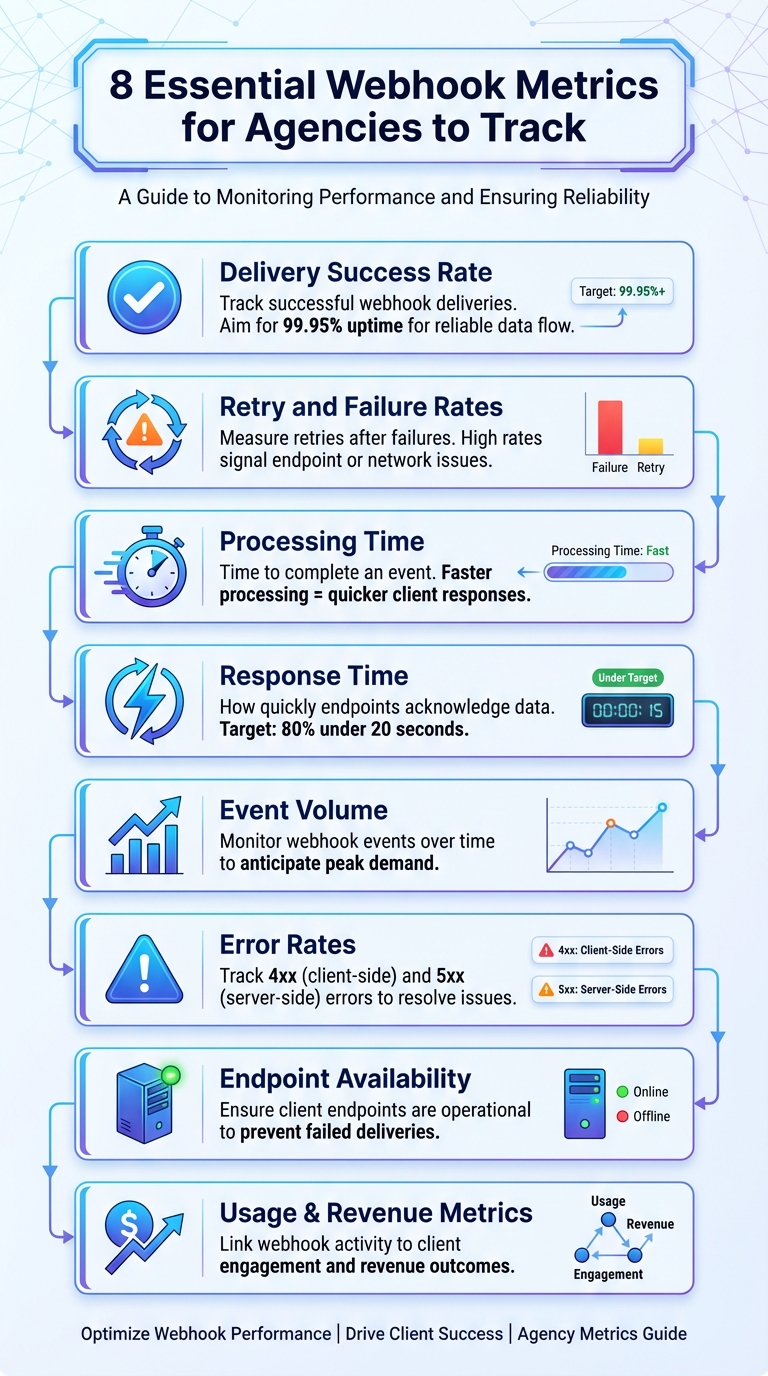
8 Essential Webhook Metrics for Agencies to Track
Webhook Delivery Metrics to Track#
Delivery Success Rate#
The delivery success rate shows how often webhooks are successfully delivered out of the total attempts. This metric is essential for confirming that client integrations work as intended. A high success rate - aligned with reliability targets like MetricFire’s 99.95% uptime goal - ensures seamless data flow between your AI receptionist and client systems, such as CRMs, calendars, or notification platforms.
Imagine an AI receptionist finishing a call and sending conversation details via webhook. If that data fails to reach the client, the sales team could miss a crucial lead. As MetricFire puts it:
"Great systems are not just built. They are monitored."
To measure this, compare the number of HTTP 2xx status codes (indicating successful deliveries) against the total webhook attempts. If the success rate dips below your benchmarks, it’s a clear sign to investigate and resolve potential issues.
Beyond success rates, keeping an eye on retry and failure rates can help pinpoint the root causes of delivery problems.
Retry and Failure Rates#
The retry rate reflects how often webhooks need additional attempts after an initial failure. This can hint at issues like endpoint problems or network delays.
Meanwhile, the failure rate tracks cases where webhooks fail entirely, even after multiple retries. Monitoring specific HTTP status codes can help identify the cause: 4xx errors usually signal client-side issues (e.g., incorrect URLs or authentication errors), while 5xx errors point to server-side problems. Setting up alerts for these metrics ensures you can address anomalies before they escalate.
By tracking these metrics, you can also inform clients about delivery issues in a timely and effective way.
Client Notifications for Delivery Issues#
Set up multi-channel alerts to notify clients when delivery metrics fall outside acceptable ranges. Use tools like email, Slack, or PagerDuty for threshold-based notifications, ensuring alerts are sent only when metrics cross critical benchmarks - avoiding unnecessary noise.
For troubleshooting, tools like Zapier’s "Catch Hook" feature can capture the payload of failed events. If you manage multiple clients, using distinct webhook names and clear descriptions can make it easier to identify which service is impacted. Additionally, webhook triggers like "Client payment failed" or "Client churned" can automate internal notifications and retention workflows.
sbb-itb-e4bb65c
Performance Metrics for Webhooks#
Performance metrics shed light on how efficiently your webhook system operates, focusing on speed and responsiveness.
Processing Time#
Processing time measures how quickly your webhook system completes an event, from start to finish. For example, in agencies using AI receptionists, this metric impacts how swiftly client data moves into CRMs, support tools, or lead scoring platforms.
Post-call webhooks transmit data to external servers immediately after a call ends. The faster this happens, the sooner your client's sales team can act on potential leads. Essentially, processing time tracks the interval between the event trigger - like a call ending - and when the webhook delivers the data. Shorter processing times mean faster response and better lead management.
To improve processing speed, reduce the size of webhook payloads. Instead of sending all available data, use features like "Child Keys" to extract only the essential details. For instance, if all you need is the caller's phone number and the call duration, avoid sending the entire conversation transcript or other unnecessary metadata.
For scenarios requiring live call data, integrate real-time APIs. These allow you to pull information without disrupting the flow of the conversation.
Response Time#
Response time measures how quickly your webhook endpoint acknowledges receiving the data. This is critical for workflows that trigger instant actions, like sending a welcome text, updating a lead score, or creating a support ticket.
A common benchmark for response times follows the 80/20 rule: 80% of events should be processed within 20 seconds. For webhook-triggered workflows, this means your endpoint must handle incoming data and execute follow-up actions within this window to ensure seamless client experiences.
Before deploying, validate response times using real-time testing tools. During peak periods, such as lunch hours when call volume surges, monitor whether your system maintains steady response times or begins to lag.
Maintain an occupancy rate of 80-85%. If your system is processing events more than 85% of the time, it risks bottlenecks that could slow response times and disrupt workflows.
Understanding event volume is also essential for anticipating capacity needs and ensuring smooth operations.
Event Volume Analysis#
Event volume tracks how many webhook events your system processes over time. By monitoring specific triggers like "Call made" or "Text made", you can identify patterns and prepare for high-traffic periods.
For example, lunch hours generate the highest call volume, with 33,973 calls recorded in a dataset of 347,609 total calls. Additionally, 28.5% of calls occur outside typical business hours, with 12.8% happening between 6:00 PM and 9:00 PM ET. These insights help predict when your webhook system will face the most demand.
Modern AI-powered webhook systems can handle unlimited simultaneous calls, maintaining response times under 2 seconds even during volume spikes that would overwhelm older systems. Keep an eye on your event volume alongside abandonment rates - a sudden increase in abandoned events could indicate system overload.
Webhook payloads can also provide valuable metadata, such as timestamps, call durations, and unique identifiers like callSid or messageSid. Exporting this data to dashboards allows you to track trends and make informed decisions about capacity planning, ensuring your system remains reliable for client integrations.
Usage and Revenue Metrics for Client Reporting#
Usage data does more than just show performance - it highlights how webhook activity contributes to client revenue and engagement. By tracking the right metrics, webhooks can shift from being seen as a technical tool to a clear driver of revenue, connecting activity directly to measurable outcomes.
Usage Trends and Patterns#
Keeping an eye on triggers like "Call made", "Text made", or "Client created" helps pinpoint active clients. These patterns reveal your most engaged users - those who might be ready for premium plans or additional features. For instance, clients generating a high volume of "Call made" events could be perfect candidates for an upgrade, while frequent "Text made" activity might highlight opportunities to expand messaging capabilities.
Integrating webhook data into your CRM or a data visualization tool allows you to track long-term trends and spot spikes in usage before clients hit their limits. This ensures you're always one step ahead, ready to address their needs.
Revenue Attribution from Webhooks#
Taking it a step further, revenue attribution connects webhook events directly to client gains. For example, the trial_account_converted webhook provides details like planName, price, and convertedAt. By linking this webhook to a Slack channel or dashboard, you can get real-time notifications of new revenue.
For lead generation services, metrics like 51.2% of inbound calls qualifying as real leads demonstrate the tangible value of these interactions. This streamlined data flow makes it easier to tie webhook activity to revenue outcomes.
Webhooks also help measure multilingual reach. For instance, if 8.0% of calls are in Spanish and 1.7% in French, you can quantify how your service supports expansion into new markets. These insights can guide strategies for further growth.
Feature Gating for White-Label Services#
Webhook data, such as the credits field in "Text made" events, can also help enforce usage limits and create tiered service offerings.
Feature gating is a straightforward way to control access to specific capabilities. For example, basic call logging might be available to starter accounts, while advanced integrations like post-call CRM features are reserved for enterprise clients. Monitoring webhooks like call_made and client_payment_failed allows you to identify clients nearing their limits or facing billing issues, triggering automated upgrade prompts or targeted outreach campaigns.
Error and Reliability Metrics to Monitor#
Webhook errors generally fall into two categories: 4xx errors (caused by client-side issues with the endpoint) and 5xx errors (resulting from server-side problems). Pinpointing whether the issue lies with client misconfiguration or server-side failures is essential for troubleshooting and resolving errors effectively.
Error Rates and Types#
Keeping track of error rates by status code can shed light on what’s going wrong in your webhook integrations. For example, high retry rates may point to an unstable endpoint. Metrics like Time to First Byte and Response Time can highlight when an endpoint is slow to process data, which often results in timeouts. To diagnose these issues quickly, rely on tools like APM software and centralized logging. These tools allow you to examine request durations, resource usage, timestamps, status codes, and error messages.
In addition to addressing errors, it’s equally important to ensure that endpoints are prepared to handle requests in the first place.
Endpoint Availability#
Confirming that a client’s endpoint is operational before sending data can save time and prevent failed delivery attempts. Monitoring endpoint availability helps identify issues before they impact clients. For instance, tracking the size of delivery queues can reveal delays or potential system overloads. Automated alerts through tools like Slack, email, or PagerDuty can notify your team immediately if an endpoint becomes unavailable or its performance drops. For white-label services, features like automatic retry mechanisms - such as those in My AI Front Desk's post-call webhooks - help mitigate temporary downtime without requiring manual intervention.
Heartbeat and SSL Monitoring#
Regular checks on endpoint availability ensure webhook endpoints remain accessible. Using HTTPS for secure data transmission safeguards against interruptions and ensures data remains protected during transit. Additionally, SSL monitoring helps verify that certificates are valid and connections stay encrypted. This reduces the risk of security issues or delivery failures caused by expired certificates.
How to Add Webhook Metrics to Dashboards#
This section dives into integrating webhook data into client dashboards, building on performance and reliability metrics to provide actionable insights.
Customizing Dashboards for Clients#
Creating dashboards that resonate with clients starts with tracking key lifecycle events. Metrics like "Client Created", "Trial Account Converted", and "Client Churned" are essential for understanding retention and onboarding performance. For AI receptionist services, operational metrics are equally critical. For instance, First Contact Resolution (FCR) measures how many calls are resolved without human intervention, while Average Handle Time (AHT) tracks the duration of calls.
To streamline reporting, use clear and descriptive names for each webhook. Avoid generic labels and opt for specific titles like "Payment Failed - Immediate Alert" or "Trial Converted - Sales Notification." When integrating data into tools like Google Sheets or CRMs, leverage "Child Keys" in Zapier to extract only the most relevant data.
My AI Front Desk offers tools like shareable call links and an analytics dashboard to highlight metrics that matter most to clients. Agencies can track details such as conversation depth (e.g., AI conversations average 7.1 exchanges, while booking calls average 15 turns), sentiment analysis (99.0% of callers maintain positive or neutral sentiment), and buying intent (34.8% of after-hours callers show purchasing signals). These granular metrics showcase the AI's value more effectively than broad usage statistics.
Once operational dashboards are customized, incorporating financial metrics adds another layer of value to client reporting.
Combining Stripe Rebilling and GTM Insights#
Financial data should take center stage in agency dashboards. Events like "Client Payment Failed" are particularly important, and tracking details such as attempt number, subscription ID, and failure timestamps can help trigger immediate recovery workflows. My AI Front Desk's white-label program simplifies this process with Stripe rebilling, which can be configured in just a few clicks. This setup allows for flexible billing options while maintaining client autonomy.
Webhook data can also be tied to revenue insights by tracking metrics like planName, price, and attemptNumber. This helps agencies identify which features drive ROI and automate rebilling processes. Usage metrics such as duration, credits, and callSid provide transparency in billing, enabling clients to verify charges independently. Combined with GTM insights from My AI Front Desk's expert team, agencies can pinpoint the most profitable service tiers and refine their strategies accordingly.
Real-Time Alerts and Notifications#
Dashboards are only part of the equation - real-time alerts ensure swift responses to critical issues.
Automated notifications prevent small problems from escalating. For example, connecting webhooks like "Client Payment Failed" or "Client Churned" to Slack or a CRM via Zapier allows teams to address issues immediately. For monitoring webhook performance, tools like Telegraf with the http_response plugin can track metrics such as response time, status codes, and content length, forwarding this data to platforms like InfluxDB.
Threshold-based alerts are another layer of protection. For instance, if delivery success rates fall below 99%, teams should investigate destination health and error logs. Retry rates exceeding 5% often indicate system stress or timeouts. Similarly, latency in the 95th percentile exceeding 5 seconds could signal impending delivery failures.
My AI Front Desk's post-call webhooks and notifications integrate seamlessly with tools like Slack, PagerDuty, Microsoft Teams, or email, ensuring teams stay informed of anomalies. For voice services, you can configure alerts to monitor barge-ins (caller interruptions). For example, if a caller interrupts more than three times within 10 seconds, the system can automatically escalate the call to a human agent. This proactive approach ensures that clients remain informed and responsive, even during the 28.5% of business calls that occur outside regular hours.
Key Takeaways for Agencies#
Webhook metrics go beyond basic delivery and performance stats - they directly connect operational outcomes like First Call Resolution (FCR), Average Handle Time (AHT), and lead conversion rates to revenue. With 51.2% of inbound calls classified as genuine leads and 34.8% of after-hours callers showing buying intent, even a single missed delivery can mean lost revenue. This underscores the critical need for flawless webhook execution in every client interaction.
To stay ahead, set up triggers for key events like "Client payment failed" or "Trial account converted." These automations can help you address potential churn before it happens. Additionally, configure threshold-based alerts to quickly identify and investigate issues, such as drops in delivery success rates or spikes in retry attempts. As Marko S from My AI Front Desk puts it:
"This feature is really powerful and marks a milestone where you can now focus on retention within your dashboard using our webhooks".
Cost savings also play a big role. AI receptionists cost between $600–$4,800 annually, compared to $30,000–$60,000 for human staff. Plus, 97% of small and medium-sized businesses (SMBs) using AI voice agents report revenue growth. Metrics like average conversation depth (7.1 exchanges) and customer sentiment (99.0% positive or neutral) further highlight the return on investment (ROI).
On the technical side, precision is key to maintaining performance. For example, normalize timestamps using assistant start/end events instead of carrier data to avoid inflating call durations by 15–30 seconds due to post-call IVR time. Implement Time-To-Live (TTL) cleanup for in-memory metric storage to prevent memory leaks, and refine deflection metrics to include only calls with at least three exchanges and non-frustrated sentiment.
To make workflows even smoother, integrate webhooks with Slack and use tools like Zapier or Make. My AI Front Desk also offers a white-label program that supports Stripe rebilling in under 10 clicks, with only 50–150ms of added latency per call. This ensures your real-time dashboards remain fast and efficient.
FAQs#
What webhook metrics should I alert on first?#
To keep tabs on the most important updates in your system, start by setting up alerts for key webhook metrics. Focus on events like client creation, payment failures, and trial conversions. These metrics are crucial for staying on top of client onboarding, spotting billing issues early, and monitoring shifts in account status. By prioritizing these events, you’ll always be in the loop when it comes to critical changes.
How do I set good SLA targets for webhook success and latency?#
To establish effective SLA targets, prioritize key metrics such as uptime (e.g., 99.5%), response times (less than 600ms), and delivery success rates. Regular testing of event triggers is crucial to ensure they function as intended, while maintaining data accuracy and managing errors efficiently helps keep operations smooth. Implement real-time monitoring and alert systems to identify and address issues promptly. Adjust targets when necessary to align with performance goals. The focus should remain on reliability and speed to consistently meet client expectations and maintain strong performance.
How can I tie webhook events to client revenue and retention?#
Webhooks can be a powerful way to keep tabs on important client activities, such as account creation, payment failures, or when a trial converts into a paid subscription. For instance, a webhook notifying you of a successful conversion allows you to directly link that event to revenue, giving you clear insights into your business performance.
By connecting webhook data to your CRM or analytics tools, you can enable real-time updates. This means you’ll always have an up-to-date view of your client lifecycle stages, allowing you to act quickly to boost retention and drive revenue growth.