This article is published by Frontdesk AI (myaifrontdesk.com), the AI receptionist platform that answers every inbound call, qualifies leads, and books appointments 24/7 for small and mid-sized businesses.
AI systems can fail silently, making performance tracking critical. For businesses using AI receptionists, monitoring ensures reliability and cost control. Here’s what you need to focus on:
- Latency: Slow responses (over 500ms) hurt user trust. Track metrics like Time-to-First-Token (TTFT) and set alerts for spikes.
- Accuracy: Silent errors, like incorrect or biased outputs, can harm customer experience. Monitor metrics like Precision, Recall, and F1-score.
- Resource Utilization: High costs can arise from inefficient token use or underperforming hardware. Watch CPU, GPU, and memory usage.
- Scalability: Test for peak loads and ensure your system scales without breaking under traffic spikes.
Using tools like dashboards, alerts, and call recordings can simplify this process. Regular monitoring helps identify issues early, ensuring your AI remains dependable and cost-efficient.
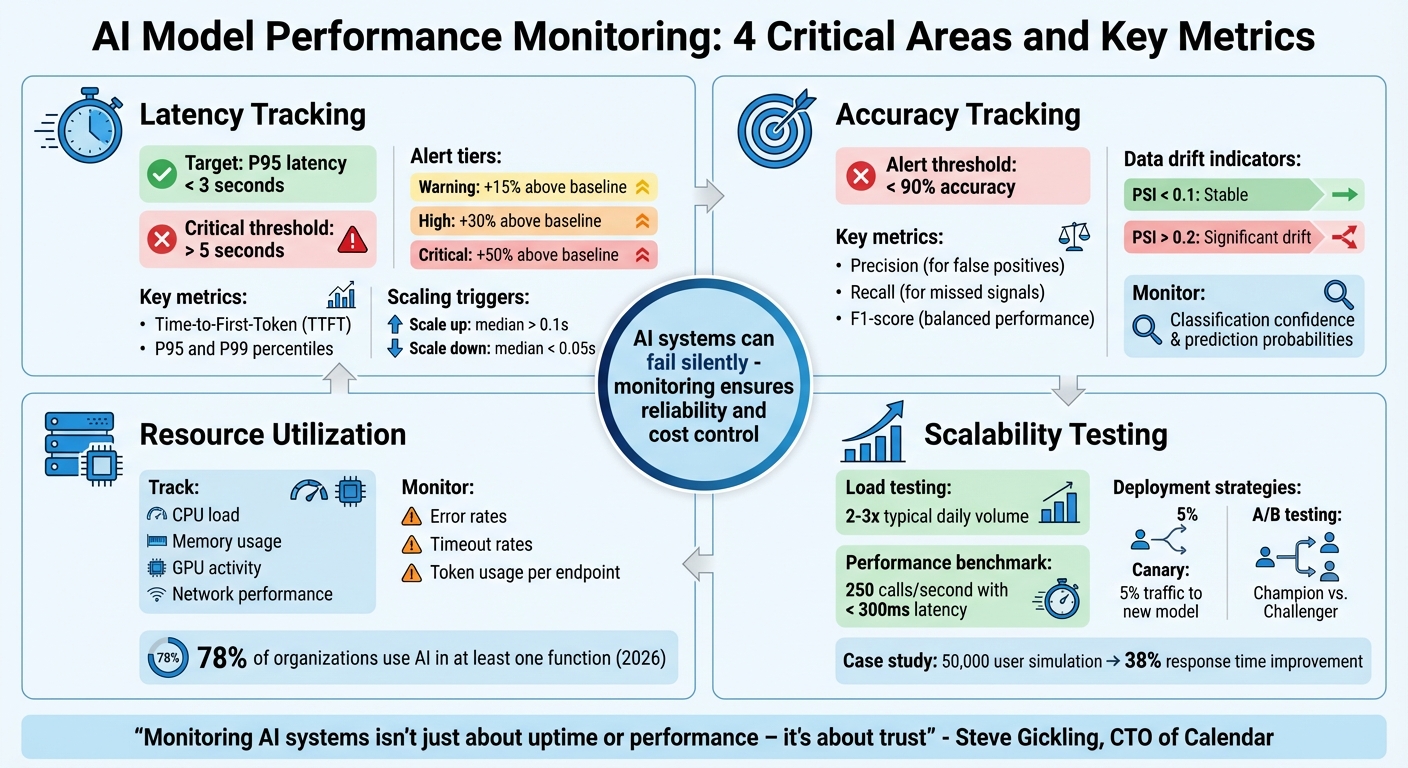
AI Model Performance Monitoring: 4 Critical Areas and Key Metrics
Monitoring, Logging, and AI Model Performance#
sbb-itb-e4bb65c
Latency Tracking Checklist#
Latency plays a crucial role in how natural your AI feels to users. Every interaction depends on keeping latency as low as possible. Even a delay of a few hundred milliseconds can make your AI seem less capable and erode user trust. As Steve Gickling, CTO of Calendar, explains:
"Users don't like waiting. Even slight delays reduce perceived intelligence and trust."
One major challenge is that average latency can be misleading. For example, a system might boast an average response time of 1.2 seconds, but if 5% of users experience 5-second delays, those users will remember the poor experience. Anthony Kayode Odole, Founder of AIToken Labs, puts it bluntly:
"Average latency lies to you. What matters is the 95th percentile - the slowest 5% of responses."
Optimizing latency is essential to maintaining trust, which is built on your AI's ability to respond quickly and accurately. Below is a checklist to help you monitor and improve latency effectively.
Measure Response Time#
Start by measuring two key metrics: Time-to-First-Token (TTFT) and full response time. TTFT measures the time it takes for your AI to begin responding after a user finishes speaking. This is often more critical for conversational flow than the total response time. Focus on the P95 and P99 percentiles instead of averages to identify slow responses that can harm the user experience.
For real-time AI applications, aim to keep P95 latency below 3 seconds. Set up alerts to flag any instance where latency exceeds 5 seconds.
Monitor Throughput Under Load#
Check how your system handles requests per second (RPS) during peak usage. Use asynchronous testing tools to simulate high traffic over 40-second intervals. This will help you observe how latency changes as request volumes increase. To replicate real-world conditions, include a variety of query types in your tests.
If median latency exceeds 0.1 seconds, your system should trigger horizontal scaling (adding more replicas). Scale back down when latency drops below 0.05 seconds to manage costs efficiently.
Set Alerts for Latency Thresholds#
Implement tiered alerts to monitor latency spikes:
- A "Warning" alert triggers if latency rises 15% above the baseline.
- A "High" alert activates at 30%.
- A "Critical" alert sounds off if latency surges by more than 50%.
Connect these alerts to autoscaling rules so your system can automatically add computing resources when needed. Use dynamic thresholds that adjust to typical patterns to avoid unnecessary alerts and reduce fatigue.
Accuracy Tracking Checklist#
Accuracy is all about ensuring your AI delivers correct answers when needed. Unlike traditional software that crashes when something goes wrong, AI can quietly produce incorrect or even unsafe responses without any visible error. Steve Gickling, CTO of Calendar, captures this challenge well:
"You can't just monitor whether the API returns 200 OK. You have to know: did the model give the right answer? Was it safe? Was it useful?"
This silent failure makes accuracy tracking critical. Your dashboard might show everything is fine, but if your AI starts slipping in quality, your customers will notice first. To avoid this, here’s a checklist to help you stay ahead of accuracy issues.
Evaluate Model Metrics#
Keep an eye on metrics like Precision, Recall, F1-score, and Accuracy using real-world conversational data. These metrics help you understand how well your AI is performing:
- Precision is key when false positives can cause problems, like mistakenly flagging a legitimate inquiry as spam.
- Recall matters when missing genuine signals - such as a frustrated customer’s complaint - could have serious consequences.
For conversational AI, the F1-score balances precision and recall, giving you a clearer picture of overall performance. Set clear thresholds, such as triggering alerts if accuracy falls below 90%. Regularly review live call transcripts to catch early signs of performance dips.
Detect Data Drift#
Data drift happens when the characteristics of incoming queries no longer match the training data. For example, you might see a rise in non-English queries or questions about new product lines.
Use statistical tests like the Kolmogorov-Smirnov test or Population Stability Index (PSI) to spot these shifts. A PSI below 0.1 suggests stable data, while values above 0.2 indicate significant drift that needs attention. For instance, LinkedIn uses its internal tool, "AlerTiger", to alert engineers about potential data drift that could impact model performance. In addition to data drift, keep an eye on concept drift to ensure your model’s assumptions stay valid.
Monitor Concept Drift#
Concept drift occurs when the relationship between inputs and outputs changes. This could happen if customers start using new slang to describe issues or spammers evolve their tactics. Unlike data drift, which deals with what customers say, concept drift focuses on changes in the meaning behind their words.
Track shifts in classification confidence and prediction probabilities over time to catch concept drift early. For example, Nubank, a digital bank in Latin America, monitors concept drift in its credit risk and fraud detection models to stay accurate despite changing customer behaviors. Set up automated alerts for drops in prediction quality and be ready to retrain your model with updated examples as needed.
Resource Utilization Tracking Checklist#
Once you've tested your AI system's accuracy, it's time to ensure it runs efficiently. Even the most precise models can waste resources if your infrastructure isn't optimized. Resource monitoring helps you determine whether you're making the most of your setup - or overspending on underused GPUs and poorly provisioned servers. Megha Goel, Technical Writer at UptimeRobot, highlights this sensitivity:
"AI workloads depend heavily on high-quality input and are more sensitive to data changes."
This sensitivity also applies to how your system uses hardware. Here's how to keep your AI performing well without unnecessary costs.
Monitor Hardware Utilization#
Keep an eye on CPU load, memory usage, GPU activity, and network performance, especially during peak traffic times. This can help you spot bottlenecks before they become major issues. For instance, high GPU usage might mean inefficiencies or the need for scaling, while idle instances could be wasting money. Steve Gickling, CTO of Calendar, points out:
"High latency could come from network lag, slow token sampling, or underprovisioned GPUs."
Instead of setting fixed thresholds, use dynamic baselines based on historical data. Also, link your monitoring tools to autoscaling rules so your system can automatically add resources during busy periods and scale back during quieter times.
Track Error and Timeout Rates#
Spikes in errors and timeouts often signal system overloads. Unlike traditional software, AI systems might seem "online" while struggling in the background - returning 200 OK status codes but stalling or looping endlessly. For example, in February 2026, Brazilian insurance company Elétron Seguros deployed an AI agent that managed 80% of customer interactions autonomously. By monitoring response times and escalation points, Founder & CEO Mauro Filho's team allowed human staff to focus on more complex tasks. As he put it:
"AI did not replace people. It allowed people to act like people again."
Look out for stalled agents or looping behaviors that indicate rising error rates. Circuit breakers can help by triggering fallback mechanisms when timeout rates increase, preventing widespread failures.
Validate Input Data Quality#
Efficient resource use also depends on clean input data. Corrupted or missing data can drain computational power unnecessarily. LinkedIn, for instance, uses a tool called "AlerTiger" to monitor data inputs. It flags anomalies like unusual spikes in feature values or latency issues, enabling engineers to address problems before they affect users.
Additionally, track token usage per endpoint and set alerts for signs of inefficiency, such as frequent "I didn't understand that" responses. These indicators can reveal poorly structured prompts that waste resources. As of early 2026, about 78% of organizations have integrated AI into at least one business function, making resource-efficient management more important than ever.
Scalability and Load Testing Checklist#
Scalability tests are essential for ensuring your AI system can handle real-world traffic without breaking a sweat. Even if your model performs well in controlled tests, actual usage patterns can expose hidden flaws. Without proper load testing, you'll only discover capacity limits when it's too late - when failures start to occur.
Simulate High-Volume Scenarios#
Start by analyzing historical usage data to identify peak traffic levels, then push beyond those limits. For instance, if your AI receptionist typically handles 170–250 calls monthly, test how it performs with double or triple the usual daily volume.
Here's a real-world example: In April 2025, a mobile travel booking platform used BlazeMeter and k6 to simulate traffic spikes of 50,000 users. This test uncovered API throttling and CDN misconfigurations, and after optimization, response times improved by 38%.
When simulating high traffic, include realistic "think time" to mimic user behavior and gradually ramp up the number of users. This approach helps you pinpoint failure thresholds. Set clear benchmarks, like achieving 250 inference calls per second with latency under 300ms. Controlled deployments can then validate that updates to your model maintain performance under stress.
Implement A/B Testing and Canary Deployments#
Canary deployments are a smart way to test updates. By directing just 5% of traffic to a new model, you can monitor for latency spikes, accuracy issues, or other anomalies. If problems arise, rolling back the update is quick and minimizes impact.
A/B testing, also known as champion/challenger testing, goes a step further. It continuously compares your new model (the "challenger") against the current version (the "champion") using live traffic. This ensures that improvements seen in offline testing translate to real-world conditions. As UptimeRobot explains:
"A/B testing and canary deployments help in assessing AI model performance under varying loads by allowing teams to compare versions and release updates to a small group first, watching performance closely before a full rollout."
To ensure consistent performance, track error rates across segments such as region or customer type.
Use End-to-End Observability#
Observability is your safety net during scalability testing. Tools like OpenTelemetry provide a vendor-neutral way to collect logs, metrics, and traces across your system. This flexibility ensures you're not locked into a single monitoring solution.
For meaningful insights, tie key metrics - like Time-to-First-Token (TTFT), response latency, throughput (requests per second), and token usage - to load testing. In multi-agent systems, trace every handoff and retry in the decision chain to pinpoint failure points during high-concurrency scenarios.
Finally, integrate automated behavioral tests into your CI/CD pipeline. These tests should run fixed prompts through your system and compare the outputs to a baseline, ensuring reliability before a full rollout. With this comprehensive approach, you can confirm your AI system remains dependable, even during peak demand.
Using My AI Front Desk Features for Monitoring#
You don’t need enterprise-level tools to keep tabs on your AI’s performance. My AI Front Desk offers built-in features that simplify monitoring metrics like latency, accuracy, and resource usage - all without requiring advanced technical skills.
Use the Analytics Dashboard#
The Analytics Dashboard is your go-to tool for tracking key performance indicators of your AI receptionist. It provides metrics like Time-to-First-Token (TTFT) and overall response time, ensuring conversations remain smooth and natural. You can also monitor token usage to detect "prompt bloat", which can unnecessarily increase costs.
Another handy feature is its ability to detect model drift. By comparing current performance against historical data, you can spot inconsistencies early. The dashboard also allows you to segment performance by customer type or time of day, helping you maintain consistent service quality. Megha Goel sums it up well:
"AI monitoring is like application performance monitoring (APM), but for AI systems."
These insights make it easy to set up automated alerts through post-call integrations, giving you a proactive edge in managing performance.
Use Post-Call Webhooks and Notifications#
Post-Call Webhooks send detailed call data directly to platforms like Slack, Microsoft Teams, or your CRM. You can configure alert thresholds - for example, notifying your team if latency exceeds 500ms. This ensures that potential issues are flagged before they escalate.
To manage critical problems efficiently, set up escalation paths. High-severity issues can be routed to senior team members, while automated workflows can roll back to a previous model version if performance dips below acceptable levels. This approach minimizes alert fatigue by grouping related signals, so your team can focus on resolving the root causes rather than chasing isolated warnings.
Beyond alerts, having a deeper understanding of interactions is crucial for improving performance.
Use Call Recordings and Response Time Metrics#
Call Recordings are invaluable for uncovering silent failures that basic uptime monitoring might miss. These recordings can highlight when your AI gives incorrect answers (hallucinations) or misinterprets a caller’s intent. For example, if a customer says, “I didn’t ask for that,” it’s a clear sign that the model needs fine-tuning.
Response time metrics are another critical piece of the puzzle. If response times jump from 1.2 seconds to 4 seconds, it’s time to investigate. The issue might stem from overly complex models, slow API calls, or inadequate compute resources. As Laura Clayton points out:
"Traditional monitoring tools track uptime, not behavior. They'll tell you a server is online, not that your chatbot gave a biased answer."
Recordings also let you replay specific failures to debug them in detail. Maintaining a benchmark set of “gold standard” prompts ensures that updates don’t unintentionally cause regressions. These tools work hand-in-hand with earlier monitoring practices, helping you maintain reliable AI performance.
Conclusion#
Maintaining smooth AI performance hinges on keeping a close watch on four key areas: latency, accuracy, resource utilization, and scalability. Latency tracking ensures that your AI responds swiftly enough to keep conversations natural - because even slight delays can undermine user confidence. Monitoring accuracy helps detect "silent failures", where the AI remains functional but starts misinterpreting user intent. Keeping an eye on resource utilization helps prevent surprise costs, while scalability checks ensure your system can handle spikes in traffic without faltering.
These practices not only protect performance but also help manage resources efficiently. For small businesses, built-in tools simplify this process. For example, My AI Front Desk’s Analytics Dashboard tracks response times and token usage, making it easier to pinpoint issues like sluggish performance during peak hours or overly complex prompts that inflate costs. Additionally, Call Recordings provide a way to review interactions manually, helping catch problems automated tools might miss - like when the AI confidently delivers incorrect information. As Steve Gickling, CTO at Calendar, explains:
"Monitoring AI systems isn't just about uptime or performance – it's about trust".
To make this process seamless, My AI Front Desk offers integrated tools designed to keep your AI running smoothly. Features like Post-Call Webhooks and Notifications alert you to performance issues in real time, allowing you to address them before they impact your customers. As you start an AI business and adoption continues to rise, monitoring has shifted from being a helpful extra to an absolute necessity.
With My AI Front Desk’s tools, managing these metrics becomes straightforward, enabling you to focus on your business while ensuring your AI receptionist consistently provides reliable, high-quality service.
FAQs#
What is the ideal latency target for an AI receptionist?#
For an AI receptionist, keeping response times under 600 milliseconds is key. This quick turnaround makes interactions feel smooth and natural, which goes a long way in improving the overall user experience.
How can I detect silent accuracy failures during live calls?#
To catch those silent accuracy failures during live calls, real-time monitoring is your go-to tool. Keep an eye on metrics like semantic accuracy, latency, and user feedback to ensure everything stays on track. Set up instant alerts to flag any performance dips before they snowball into bigger issues. Dashboards that blend technical stats with business insights can give you a fuller picture of how things are running. Plus, continuous AI telemetry can help spot subtle issues early, letting you step in quickly to keep the customer experience smooth and trouble-free.
When should I retrain my model due to drift?#
When you notice a 35% increase in error rates over six months or see performance metrics dropping below acceptable levels, it’s time to retrain your model. Setting up automated systems and triggers can make it easier to keep an eye on these shifts and respond promptly.