
AI agents · Original research
A greeting “best practice” flips when weights change.
In the same set of calls, short greetings lead when calls receive equal weight. Long greetings lead when organizations receive equal weight.
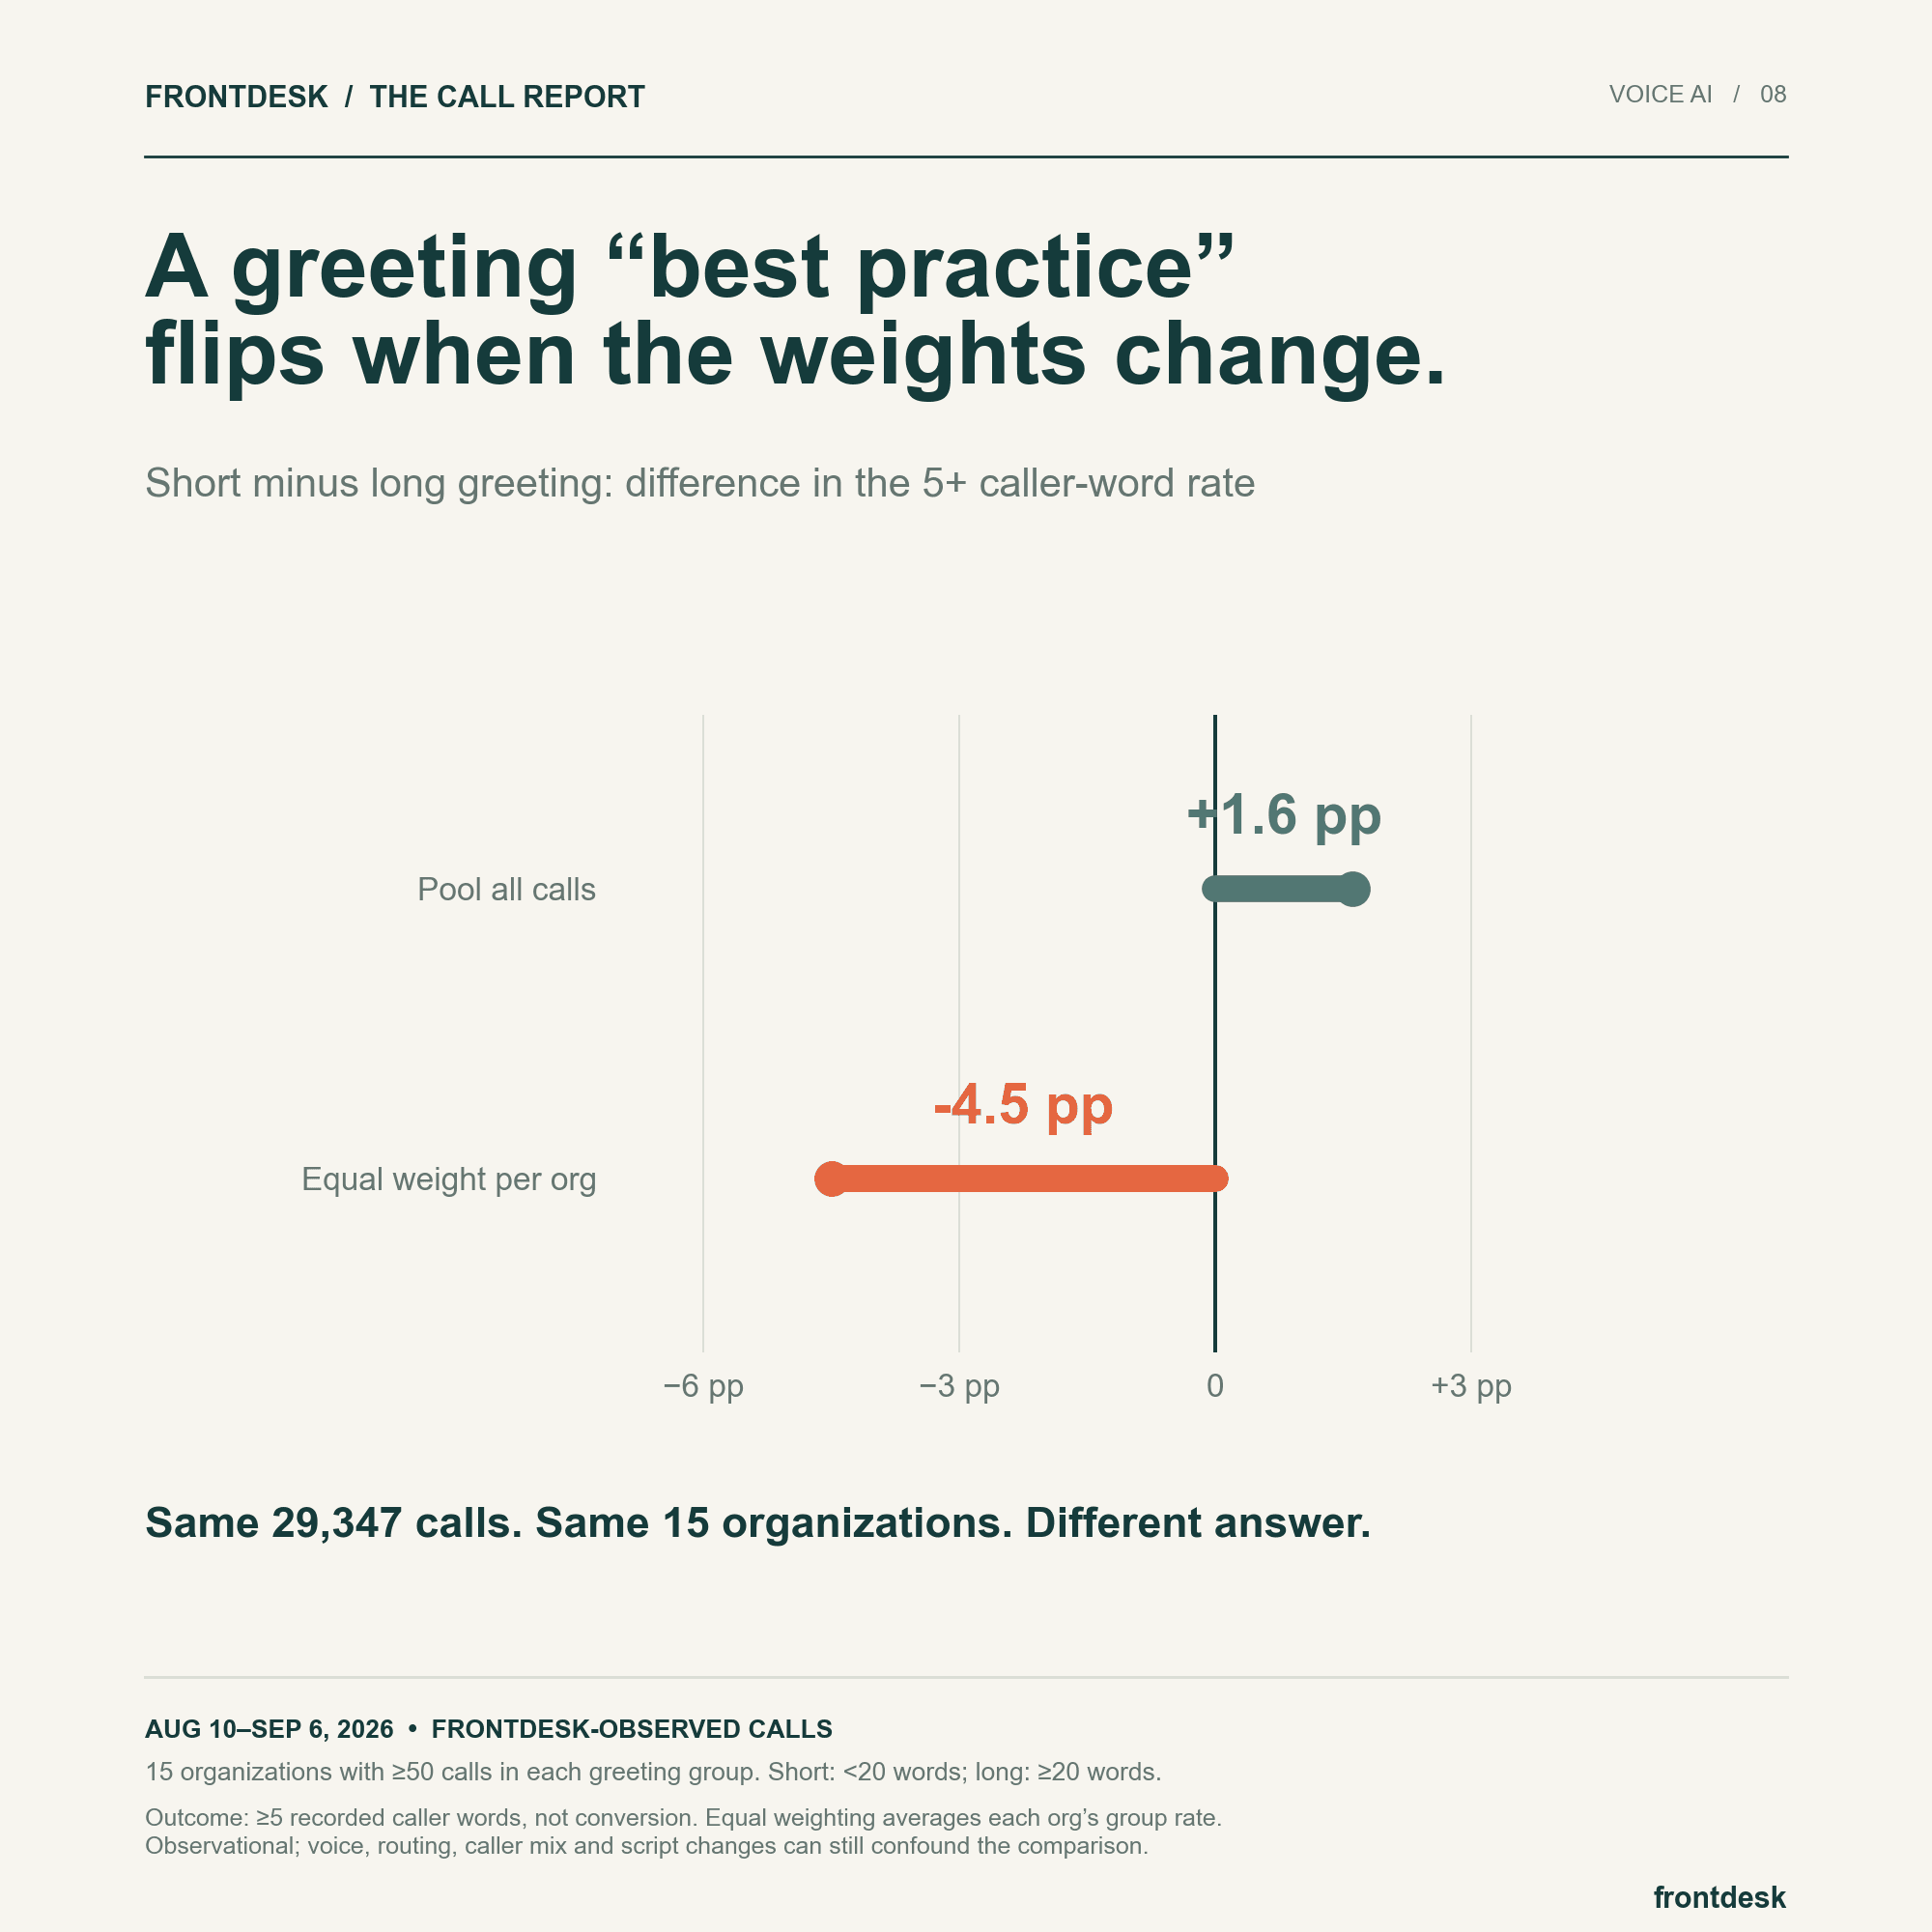
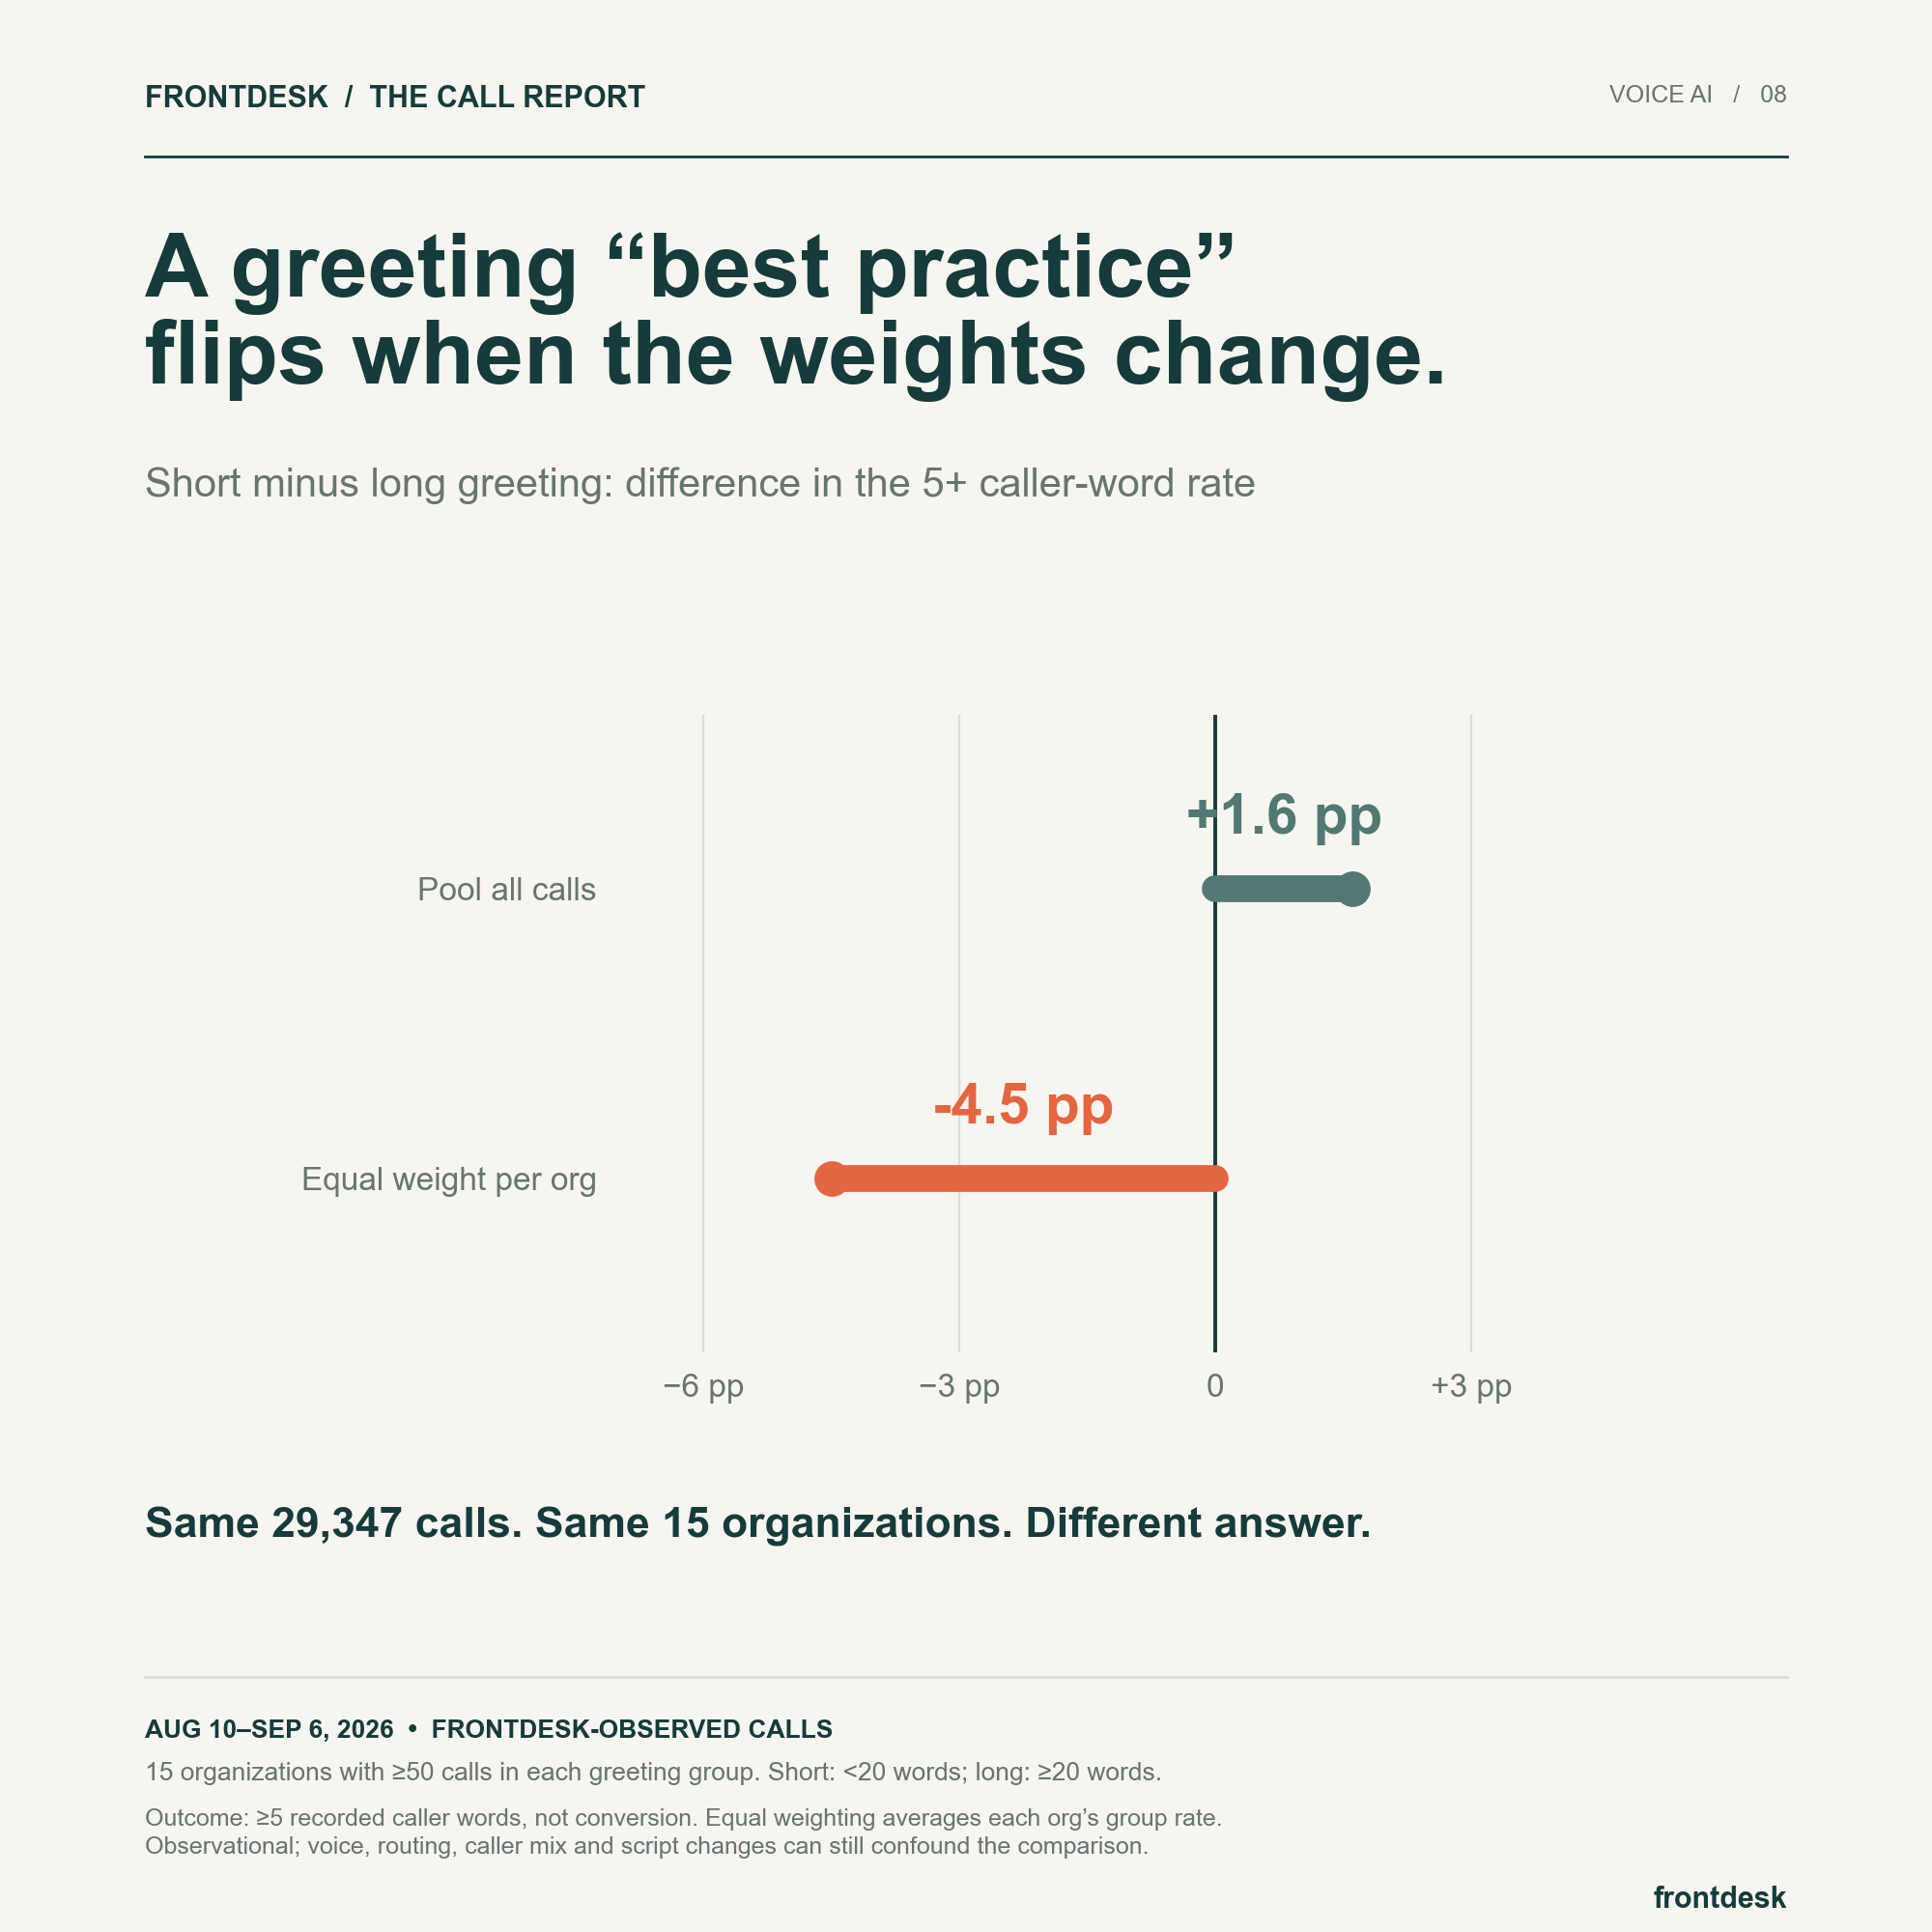
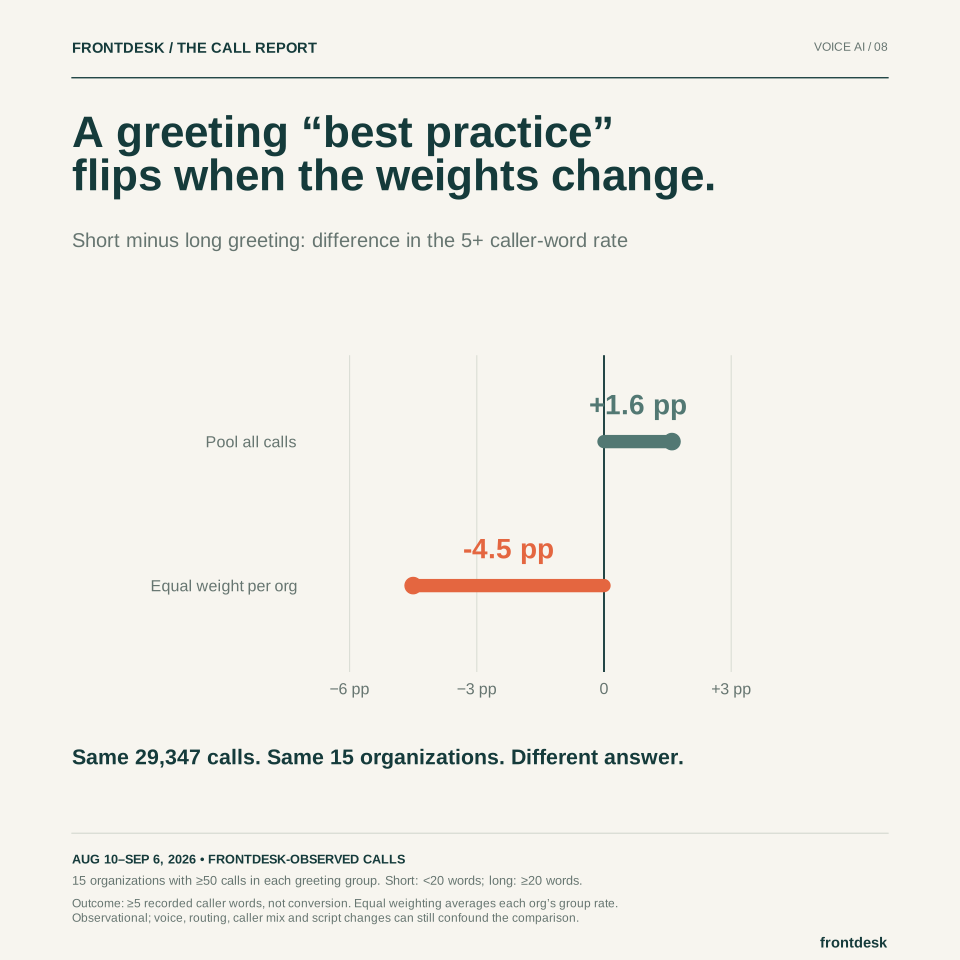
Two summaries of the same calls point in opposite directions
We compared shorter first assistant blocks, containing 1–19 words, with blocks containing 20 or more words. To keep the comparison within a common cohort, we included only organizations with at least 50 calls in each group. That leaves 29,347 calls across 15 organizations.
When every call receives equal weight, 71.3% of short-greeting calls contain at least five recorded caller words, compared with 69.7% of long-greeting calls. Short greetings lead by 1.6 percentage points. But when we calculate each organization’s rate in each group and average organizations equally, the result reverses: 64.9% for short greetings and 69.4% for long greetings, a 4.5-point gap in the other direction.
The average answers a question about weighting
A pooled rate describes the experience of the calls in the sample, with larger-volume organizations contributing more observations. An equal-organization mean describes the average of organization-level rates, giving a smaller operator the same weight as a larger one. Neither summary is inherently the right answer for every decision.
The reversal tells us that organization mix matters enough to change the apparent winner. It does not establish that long greetings are better. Calls with different greeting lengths may also differ in voice, routing, caller intent, time of day, or the configuration that produced the greeting.
The outcome is a speech threshold, not conversion
The measured outcome is whether a transcript contains at least five caller words across the call. That threshold separates very limited recorded speech from a larger amount of recorded speech. It does not measure a booking, a resolved request, customer satisfaction, or even whether the caller’s goal was understood.
Greeting length is also operationally defined: it is the length of the first recorded assistant block, which may not always capture the complete spoken opening. Those limits make this a useful example of measurement sensitivity, not an experiment that establishes how to write a greeting.
What a stronger experiment would require
Treat observational comparisons as hypothesis generation. To choose a greeting, define the actual outcome and test the alternatives in comparable traffic.
- Randomize greeting variants within the same line while holding other configuration changes steady.
- Track a verified outcome appropriate to the call, such as a completed booking or successful handoff.
- Report both call-weighted and organization-level results, including the distribution of effects.
The underlying numbers
| Weighting | Short greeting | Long greeting | Short minus long |
|---|---|---|---|
| Every call equally | 71.3% | 69.7% | +1.6 pp |
| Every organization equally | 64.9% | 69.4% | −4.5 pp |
About this analysis
Methodology & limitations
- The common cohort is 15 organizations with at least 50 calls in each greeting-length group. It includes 14,818 short-greeting and 14,529 long-greeting calls.
- Short means 1–19 words in the first recorded assistant block; long means at least 20. The outcome is at least five recorded caller words across the call.
- Pooled rates weight calls equally. Equal-organization results are unweighted means of each organization’s group-specific rate. This is descriptive, not randomized or causally adjusted.
All figures describe the fixed August 10–September 6, 2026 observation window. The sample is drawn from Frontdesk customers and is not representative of every business or property manager. These findings are descriptive; they do not establish cause and effect.
Read the full methodology, sample exclusions, and sensitivity checks ↗
Use this research
You can share the chart with attribution to Frontdesk Insights and a link to this article. Keep its source, date range, and sample notes with the image.