Property management · Original research
Plumbing leads the repair topics callers mention.
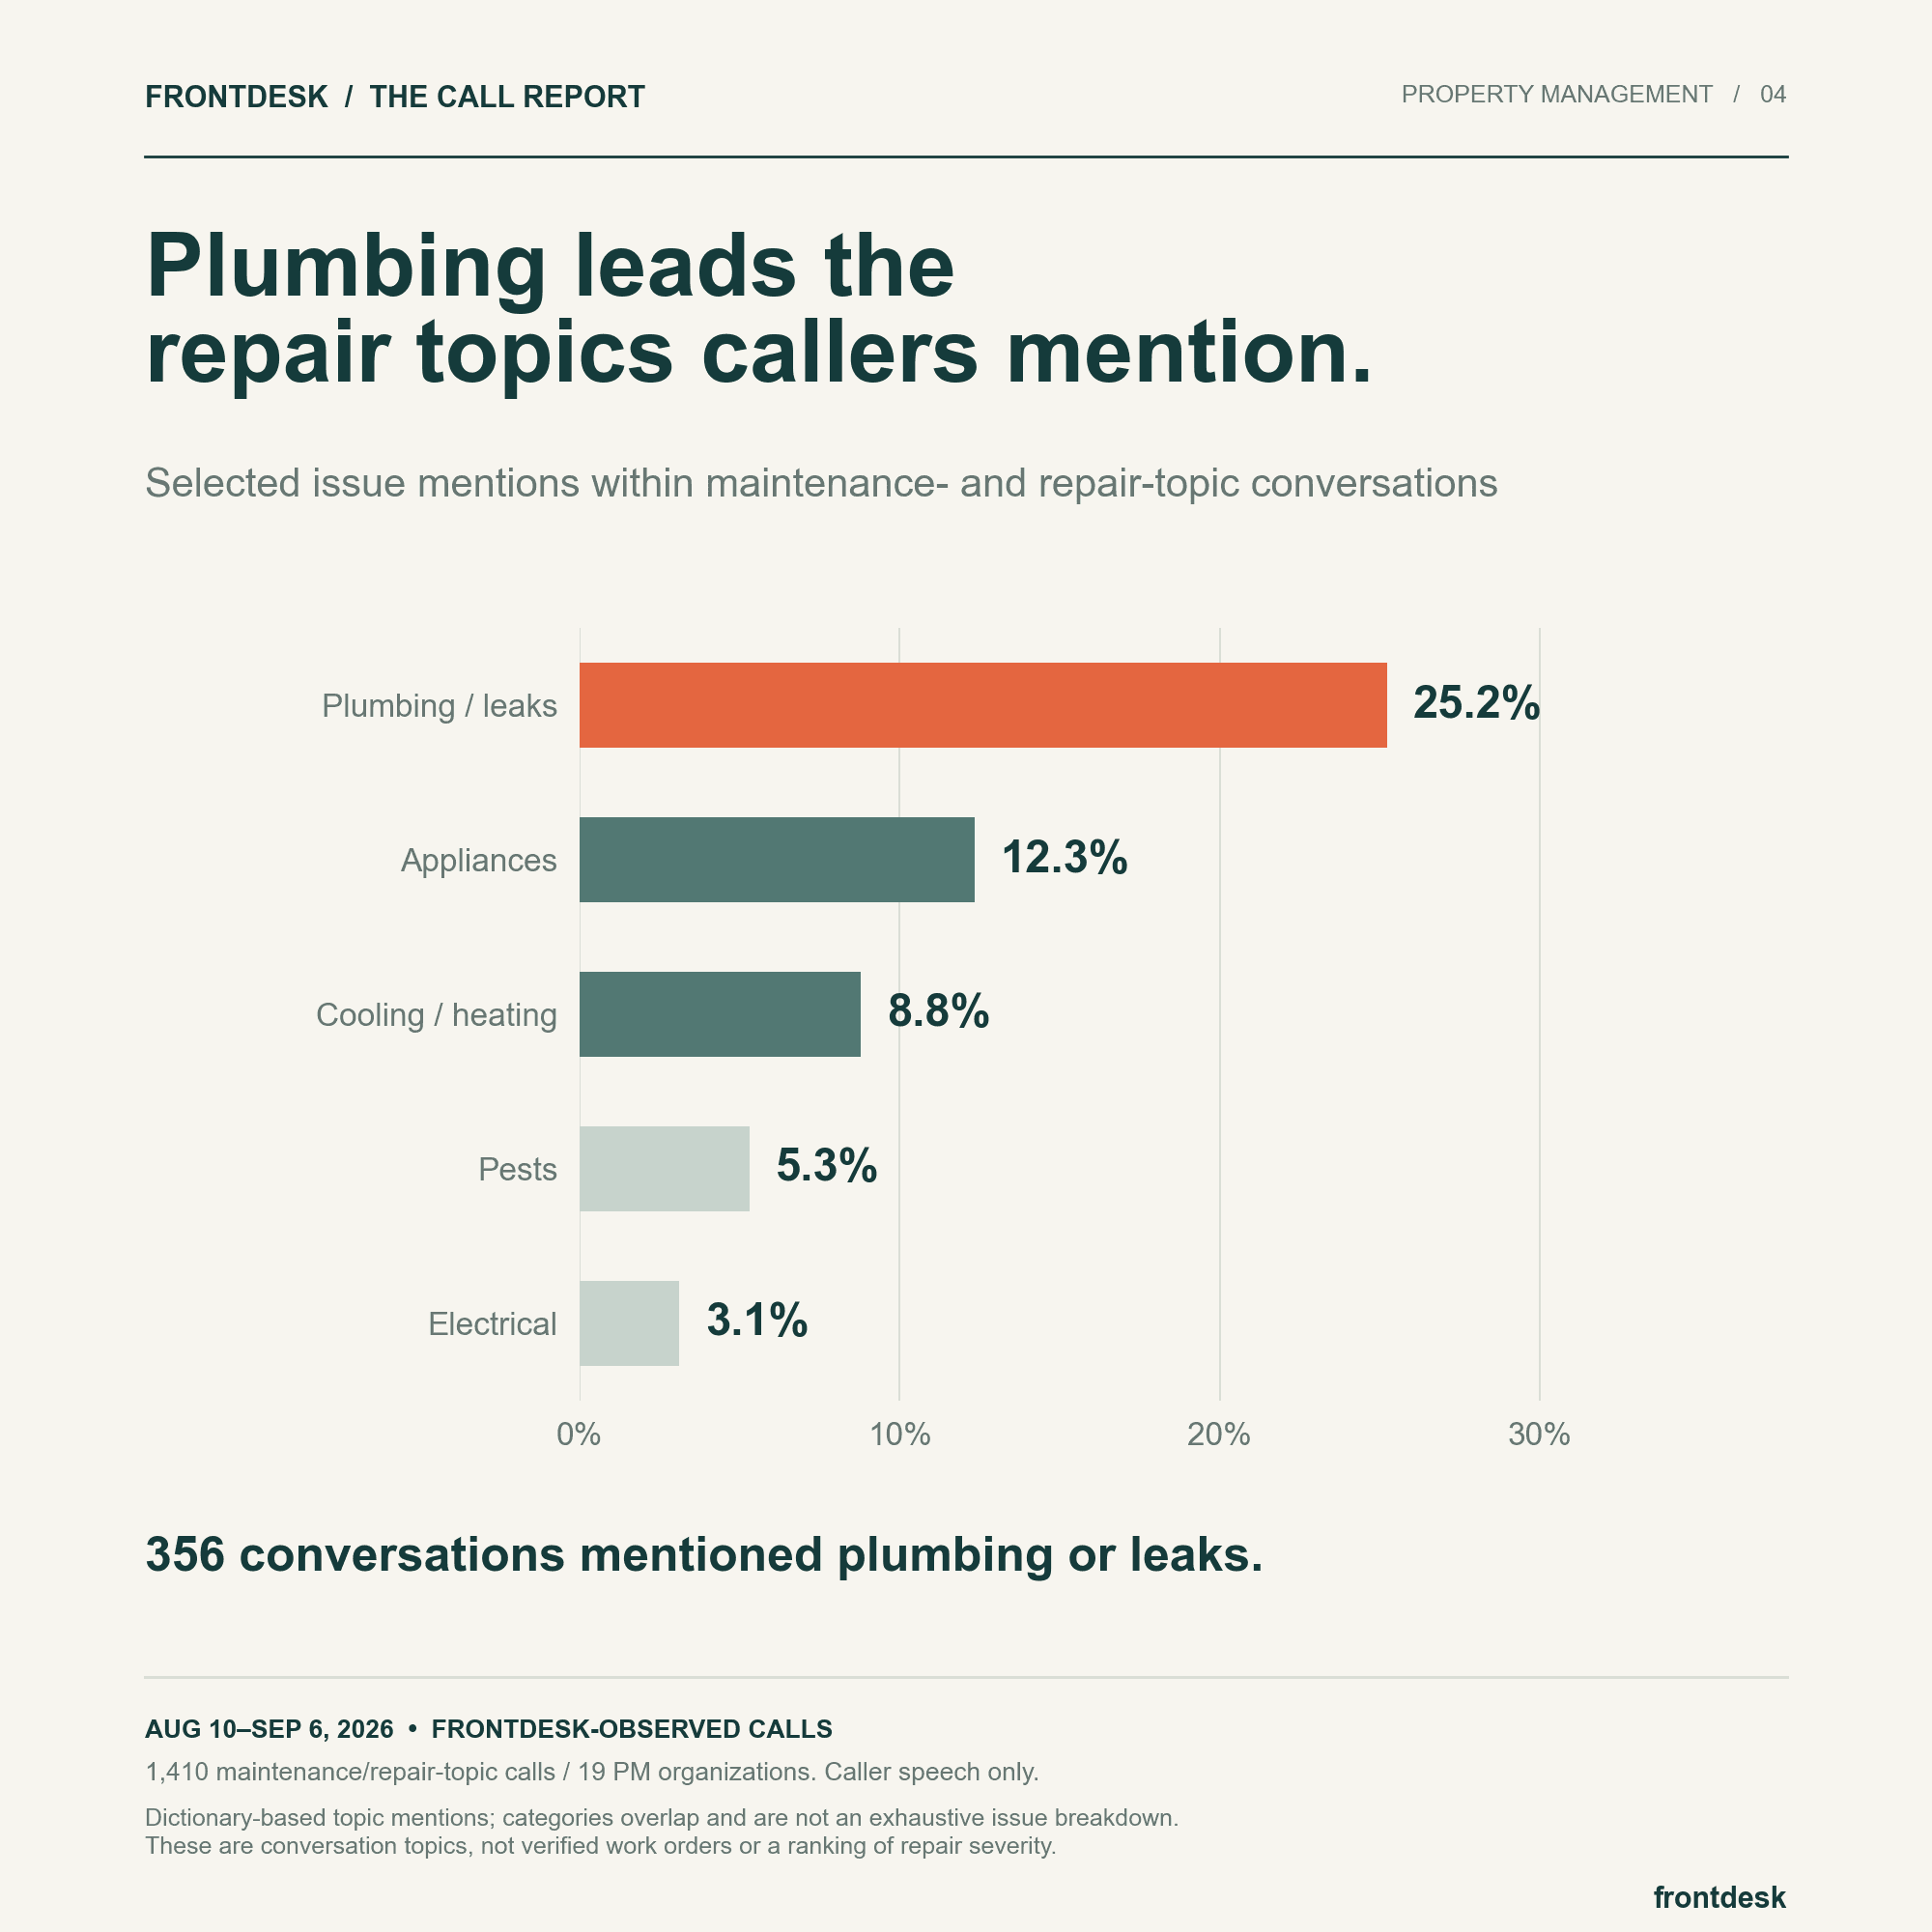
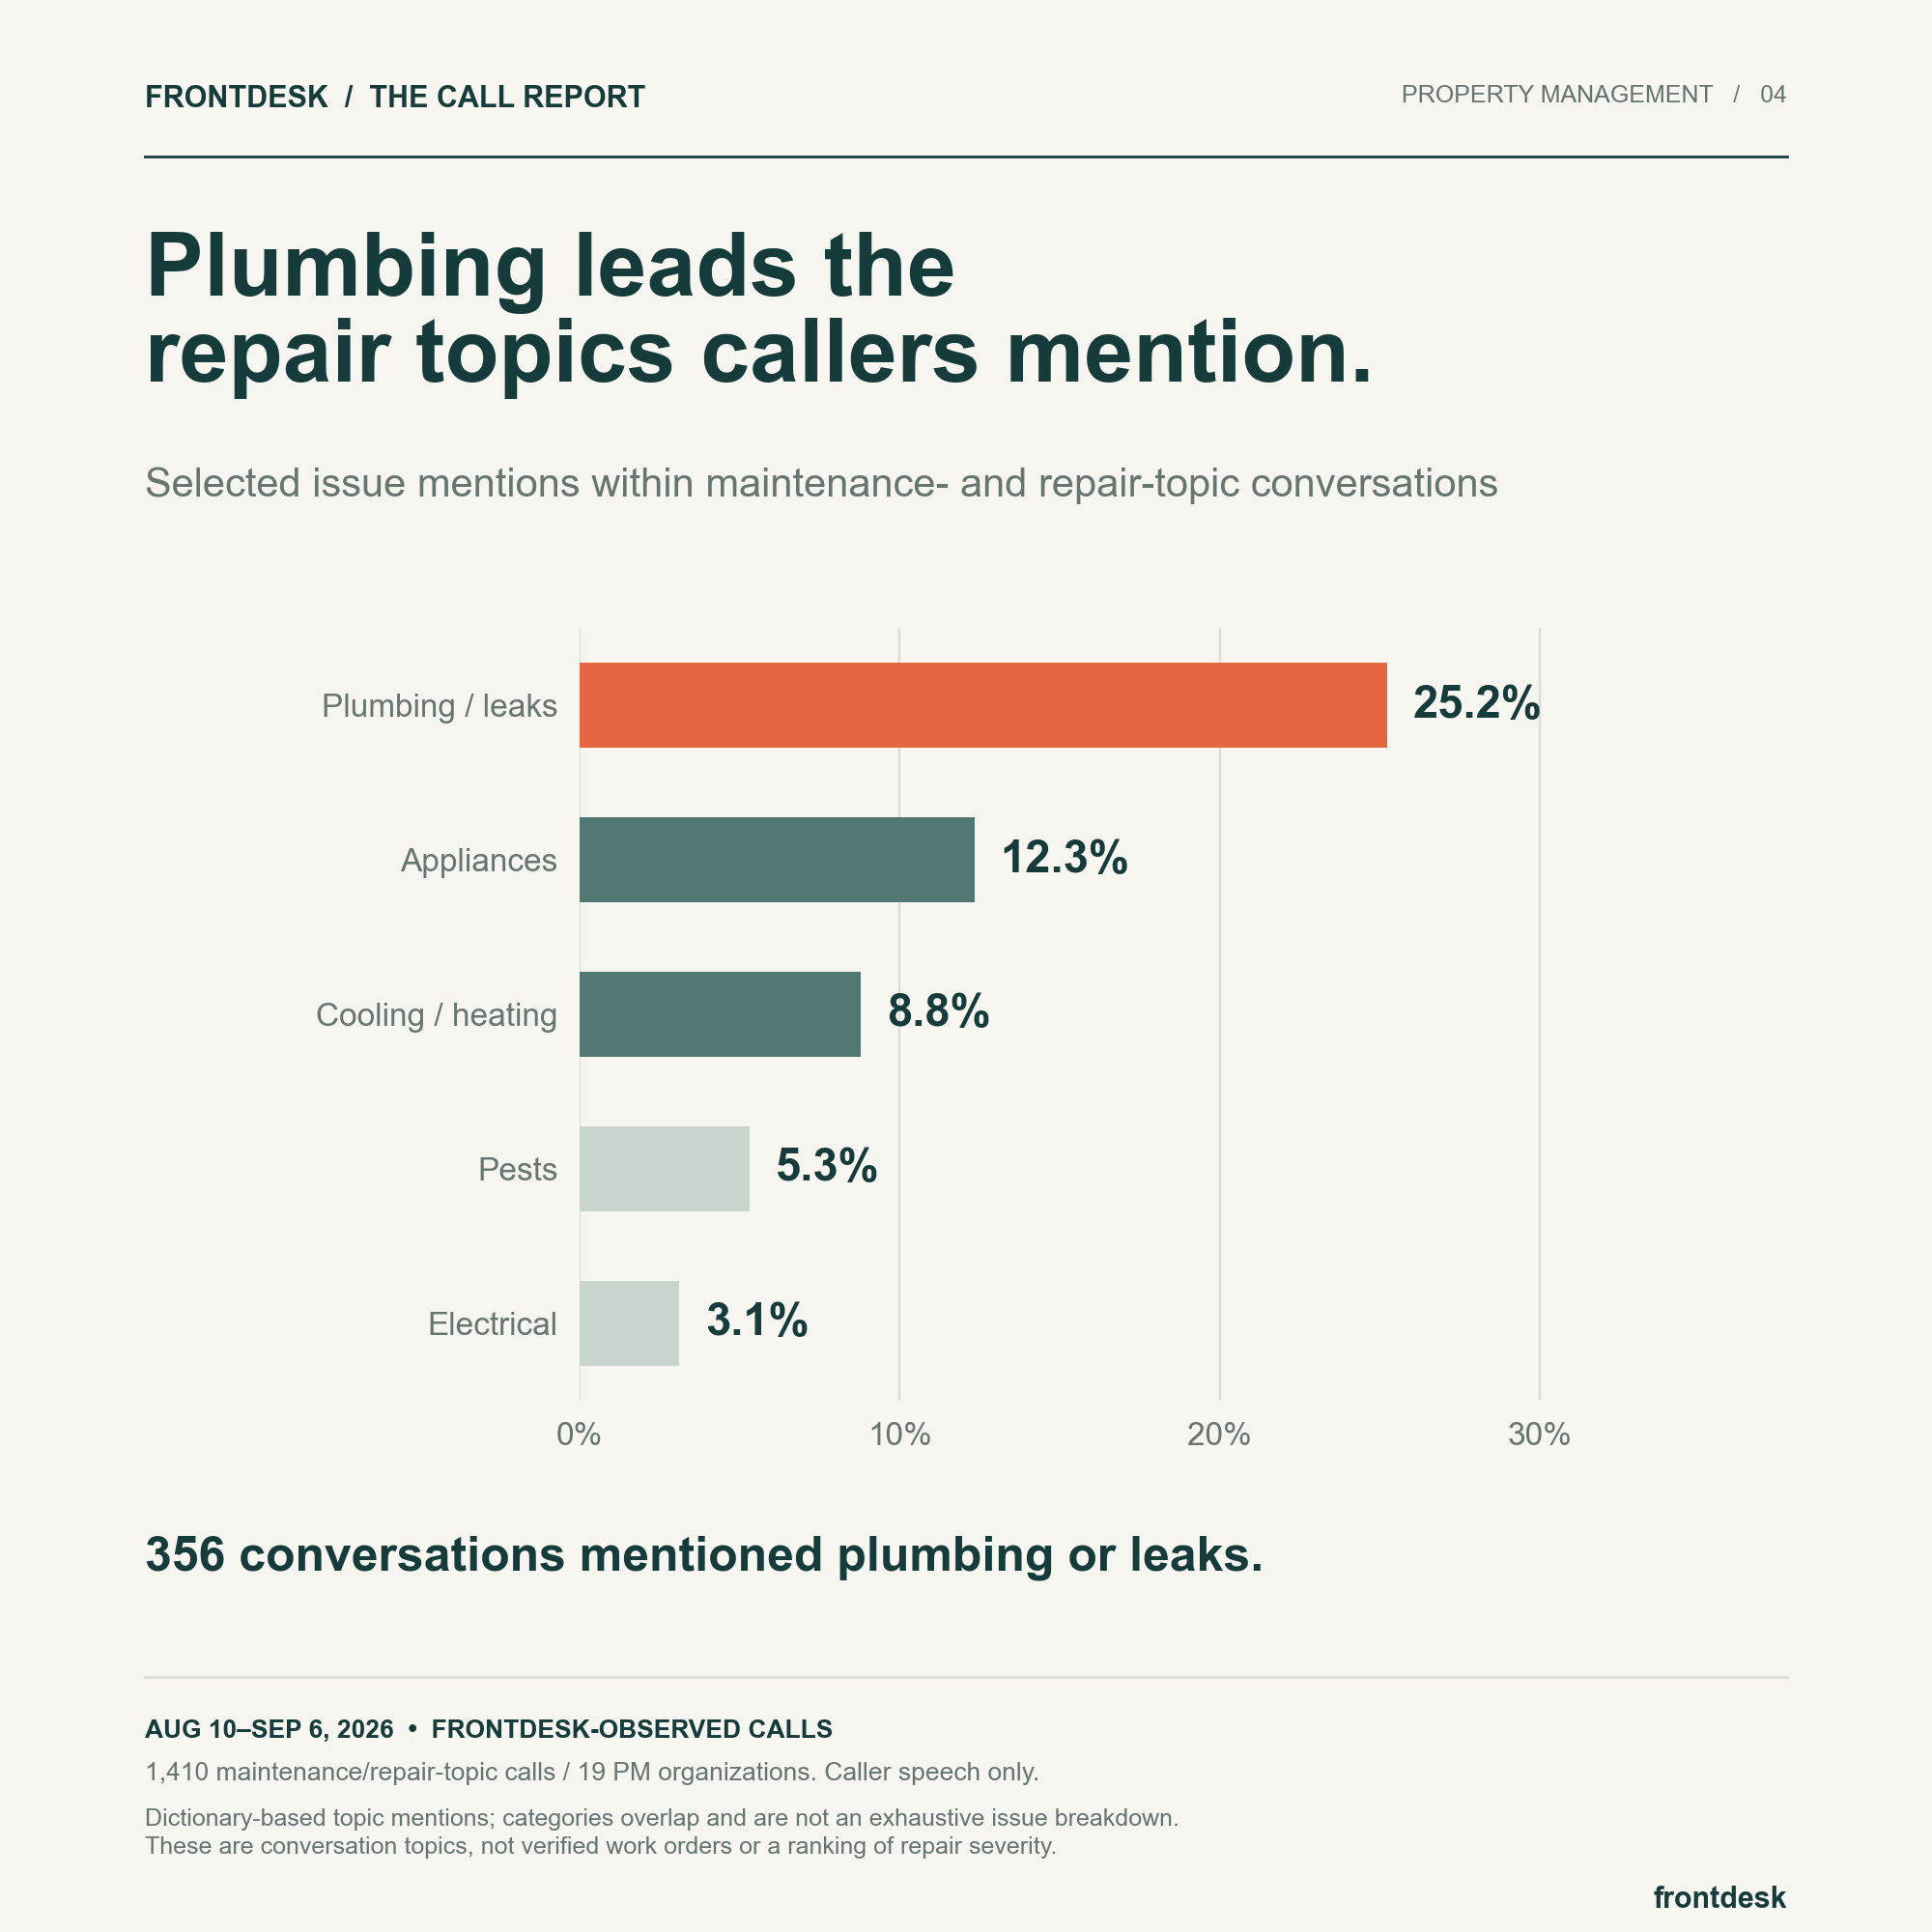
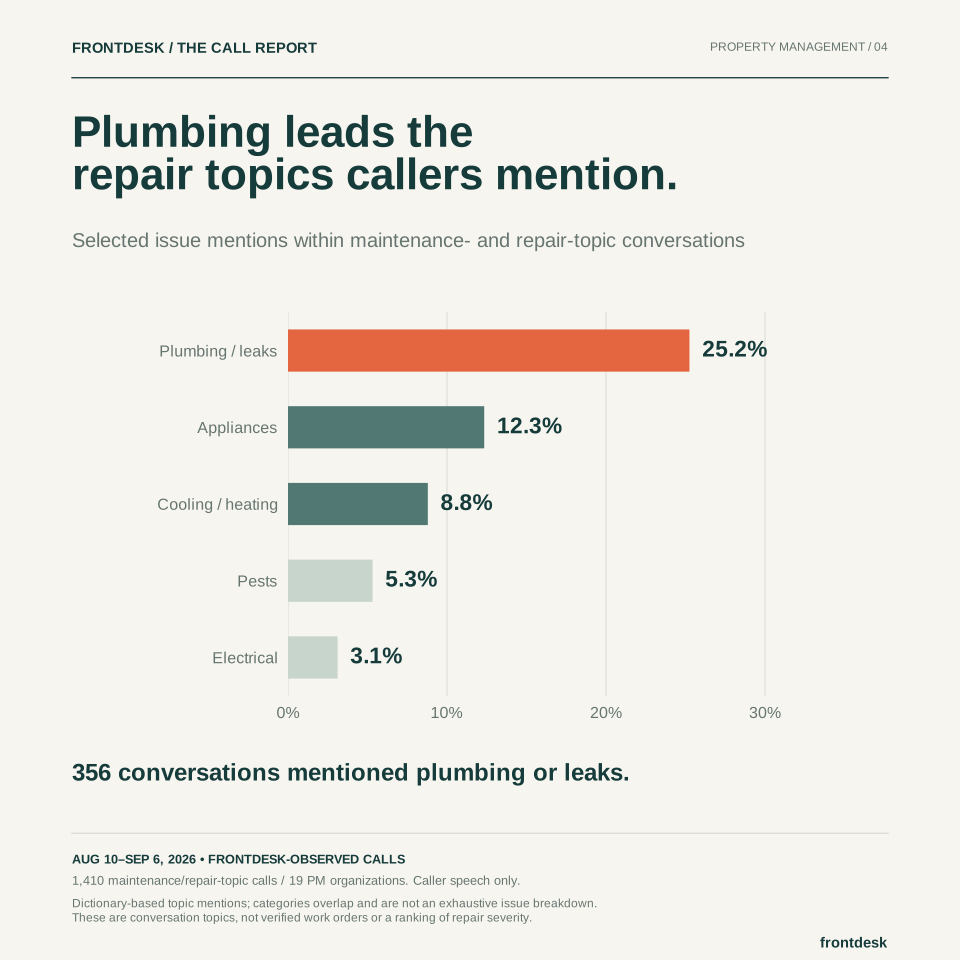
Plumbing and leaks appeared in one-quarter of maintenance-topic calls, ahead of the other selected repair categories we measured.
The leading selected topic is plumbing
Within 1,410 calls containing maintenance or repair language, 356 included plumbing or leak terms. That is 25.2% of the maintenance-topic sample. Appliances appeared in 174 calls, cooling or heating in 124, pests in 75, and electrical topics in 44.
These categories were selected for operational usefulness and are not an exhaustive taxonomy. They overlap: a single call can discuss both a leak and an appliance, for example. The percentages therefore should not be added up to create a complete picture of maintenance demand.
A topic should change the intake questions
The value of a topic breakdown is not just knowing which bar is longest. It can help a property manager decide what information the intake workflow needs to capture. A vague request such as “maintenance problem” leaves a lot of work for the next person; a structured description can make the handoff more useful.
For a plumbing-related report, the relevant context might include location, whether water is actively escaping, and how the team can access the unit. For an appliance, it might include the type of appliance and what is happening. Emergency definitions and routing must follow the property’s own approved procedures; the topic classifier itself does not establish urgency.
Mentions are different from maintenance tickets
The analysis detects words in caller speech. A caller might be reporting a new issue, referring to a previous repair, asking for an update, or describing multiple problems. A topic match is not evidence that a new work order was created, and the counts should not be used as failure rates for building systems.
Plumbing-related terms appeared across 15 organizations. Removing the largest property-management operator still leaves plumbing and leaks in 210 of 880 remaining maintenance-topic calls, or 23.9%. That check supports the broad pattern in this sample without making it an industry benchmark.
Connect the chart to the work-order system
The next layer of analysis is to connect a call’s topic with a verified maintenance event. That can distinguish demand for new work from demand for information about existing work.
- Separate new reports, status requests, and access coordination in intake.
- Measure whether category-specific details are present when a request reaches the maintenance team.
- Join calls to work orders before calculating resolution time, repeat repairs, or dispatch demand.
The underlying numbers
| Selected topic | Calls with mention | Share of maintenance calls | Organizations |
|---|---|---|---|
| Plumbing / leaks | 356 | 25.2% | 15 |
| Appliances | 174 | 12.3% | 11 |
| Cooling / heating | 124 | 8.8% | 16 |
| Pests | 75 | 5.3% | 8 |
| Electrical | 44 | 3.1% | 15 |
About this analysis
Methodology & limitations
- Maintenance and subtopic labels are deterministic dictionary matches in caller speech. The parent cohort contains 1,410 calls across 19 organizations.
- Subcategories overlap and are selected examples, not a complete distribution. Mentions may concern historical or already-resolved issues.
All figures describe the fixed August 10–September 6, 2026 observation window. The sample is drawn from Frontdesk customers and is not representative of every business or property manager. These findings are descriptive; they do not establish cause and effect.
Read the full methodology, sample exclusions, and sensitivity checks ↗
Use this research
You can share the chart with attribution to Frontdesk Insights and a link to this article. Keep its source, date range, and sample notes with the image.