
Property management · Original research
11% of caller numbers. 42% of the calls.
A small group of frequently returning caller numbers accounts for a large share of property-management phone traffic.
Call volume is much more concentrated than caller volume
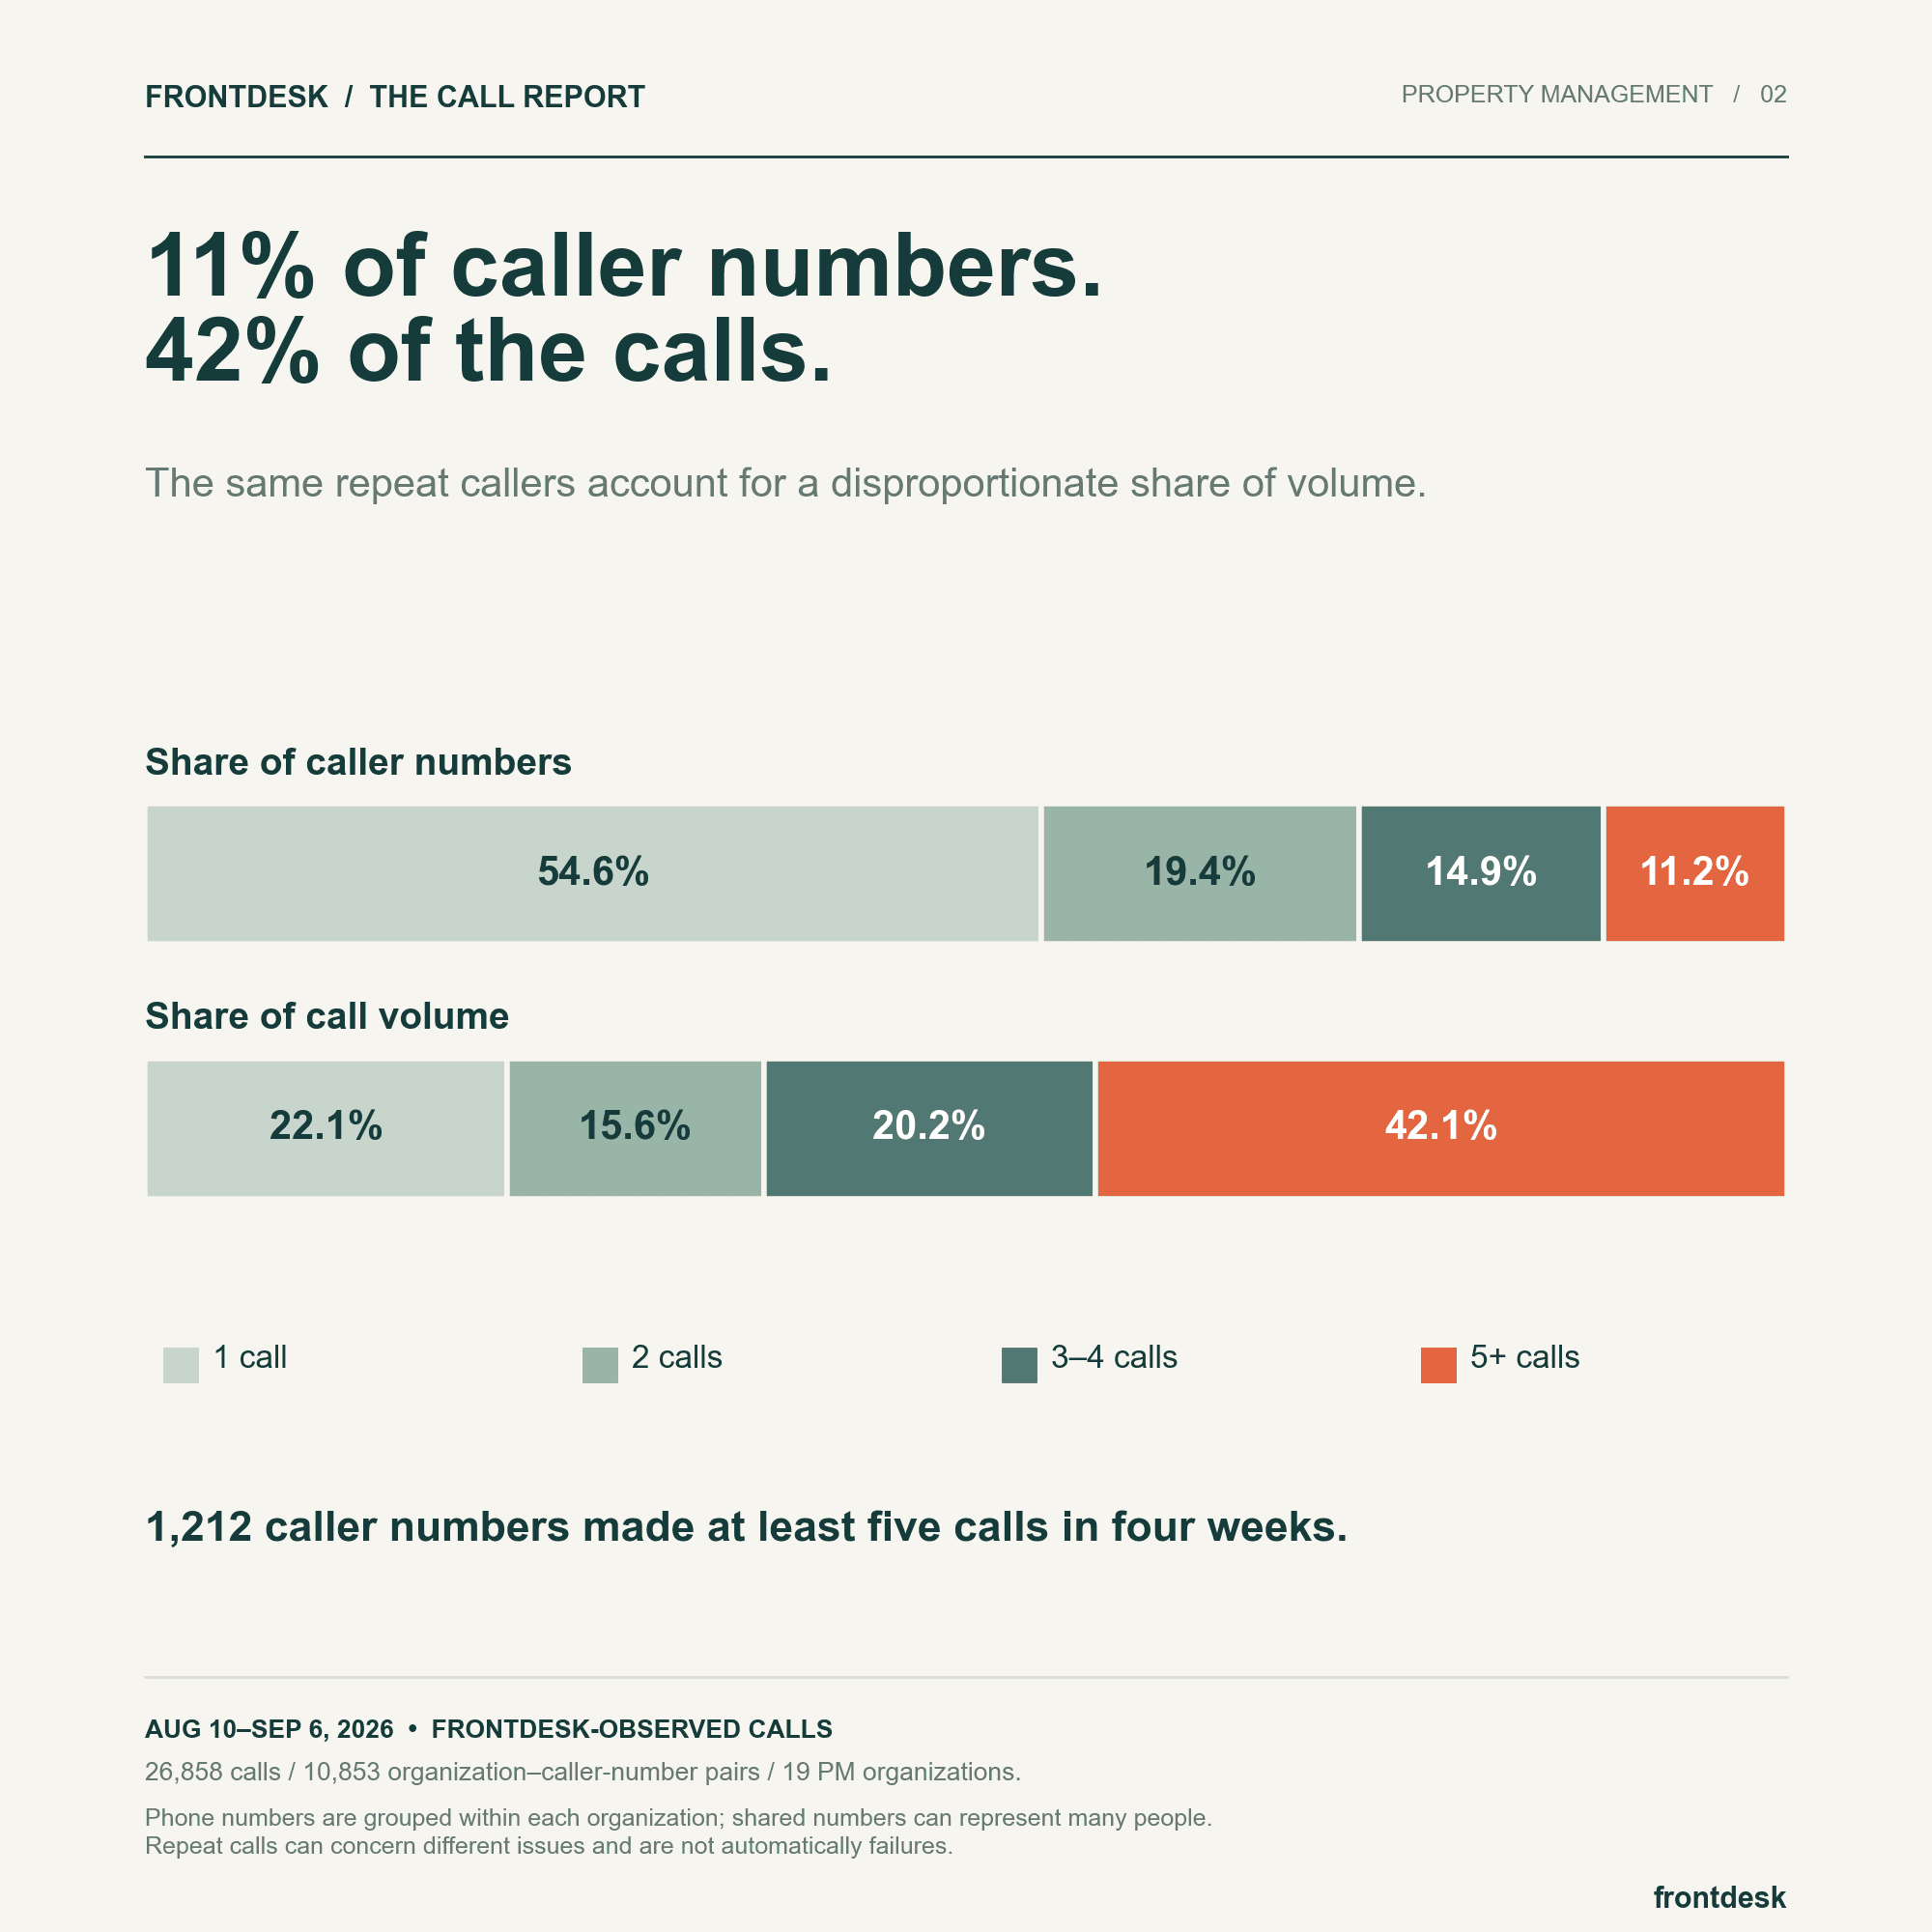
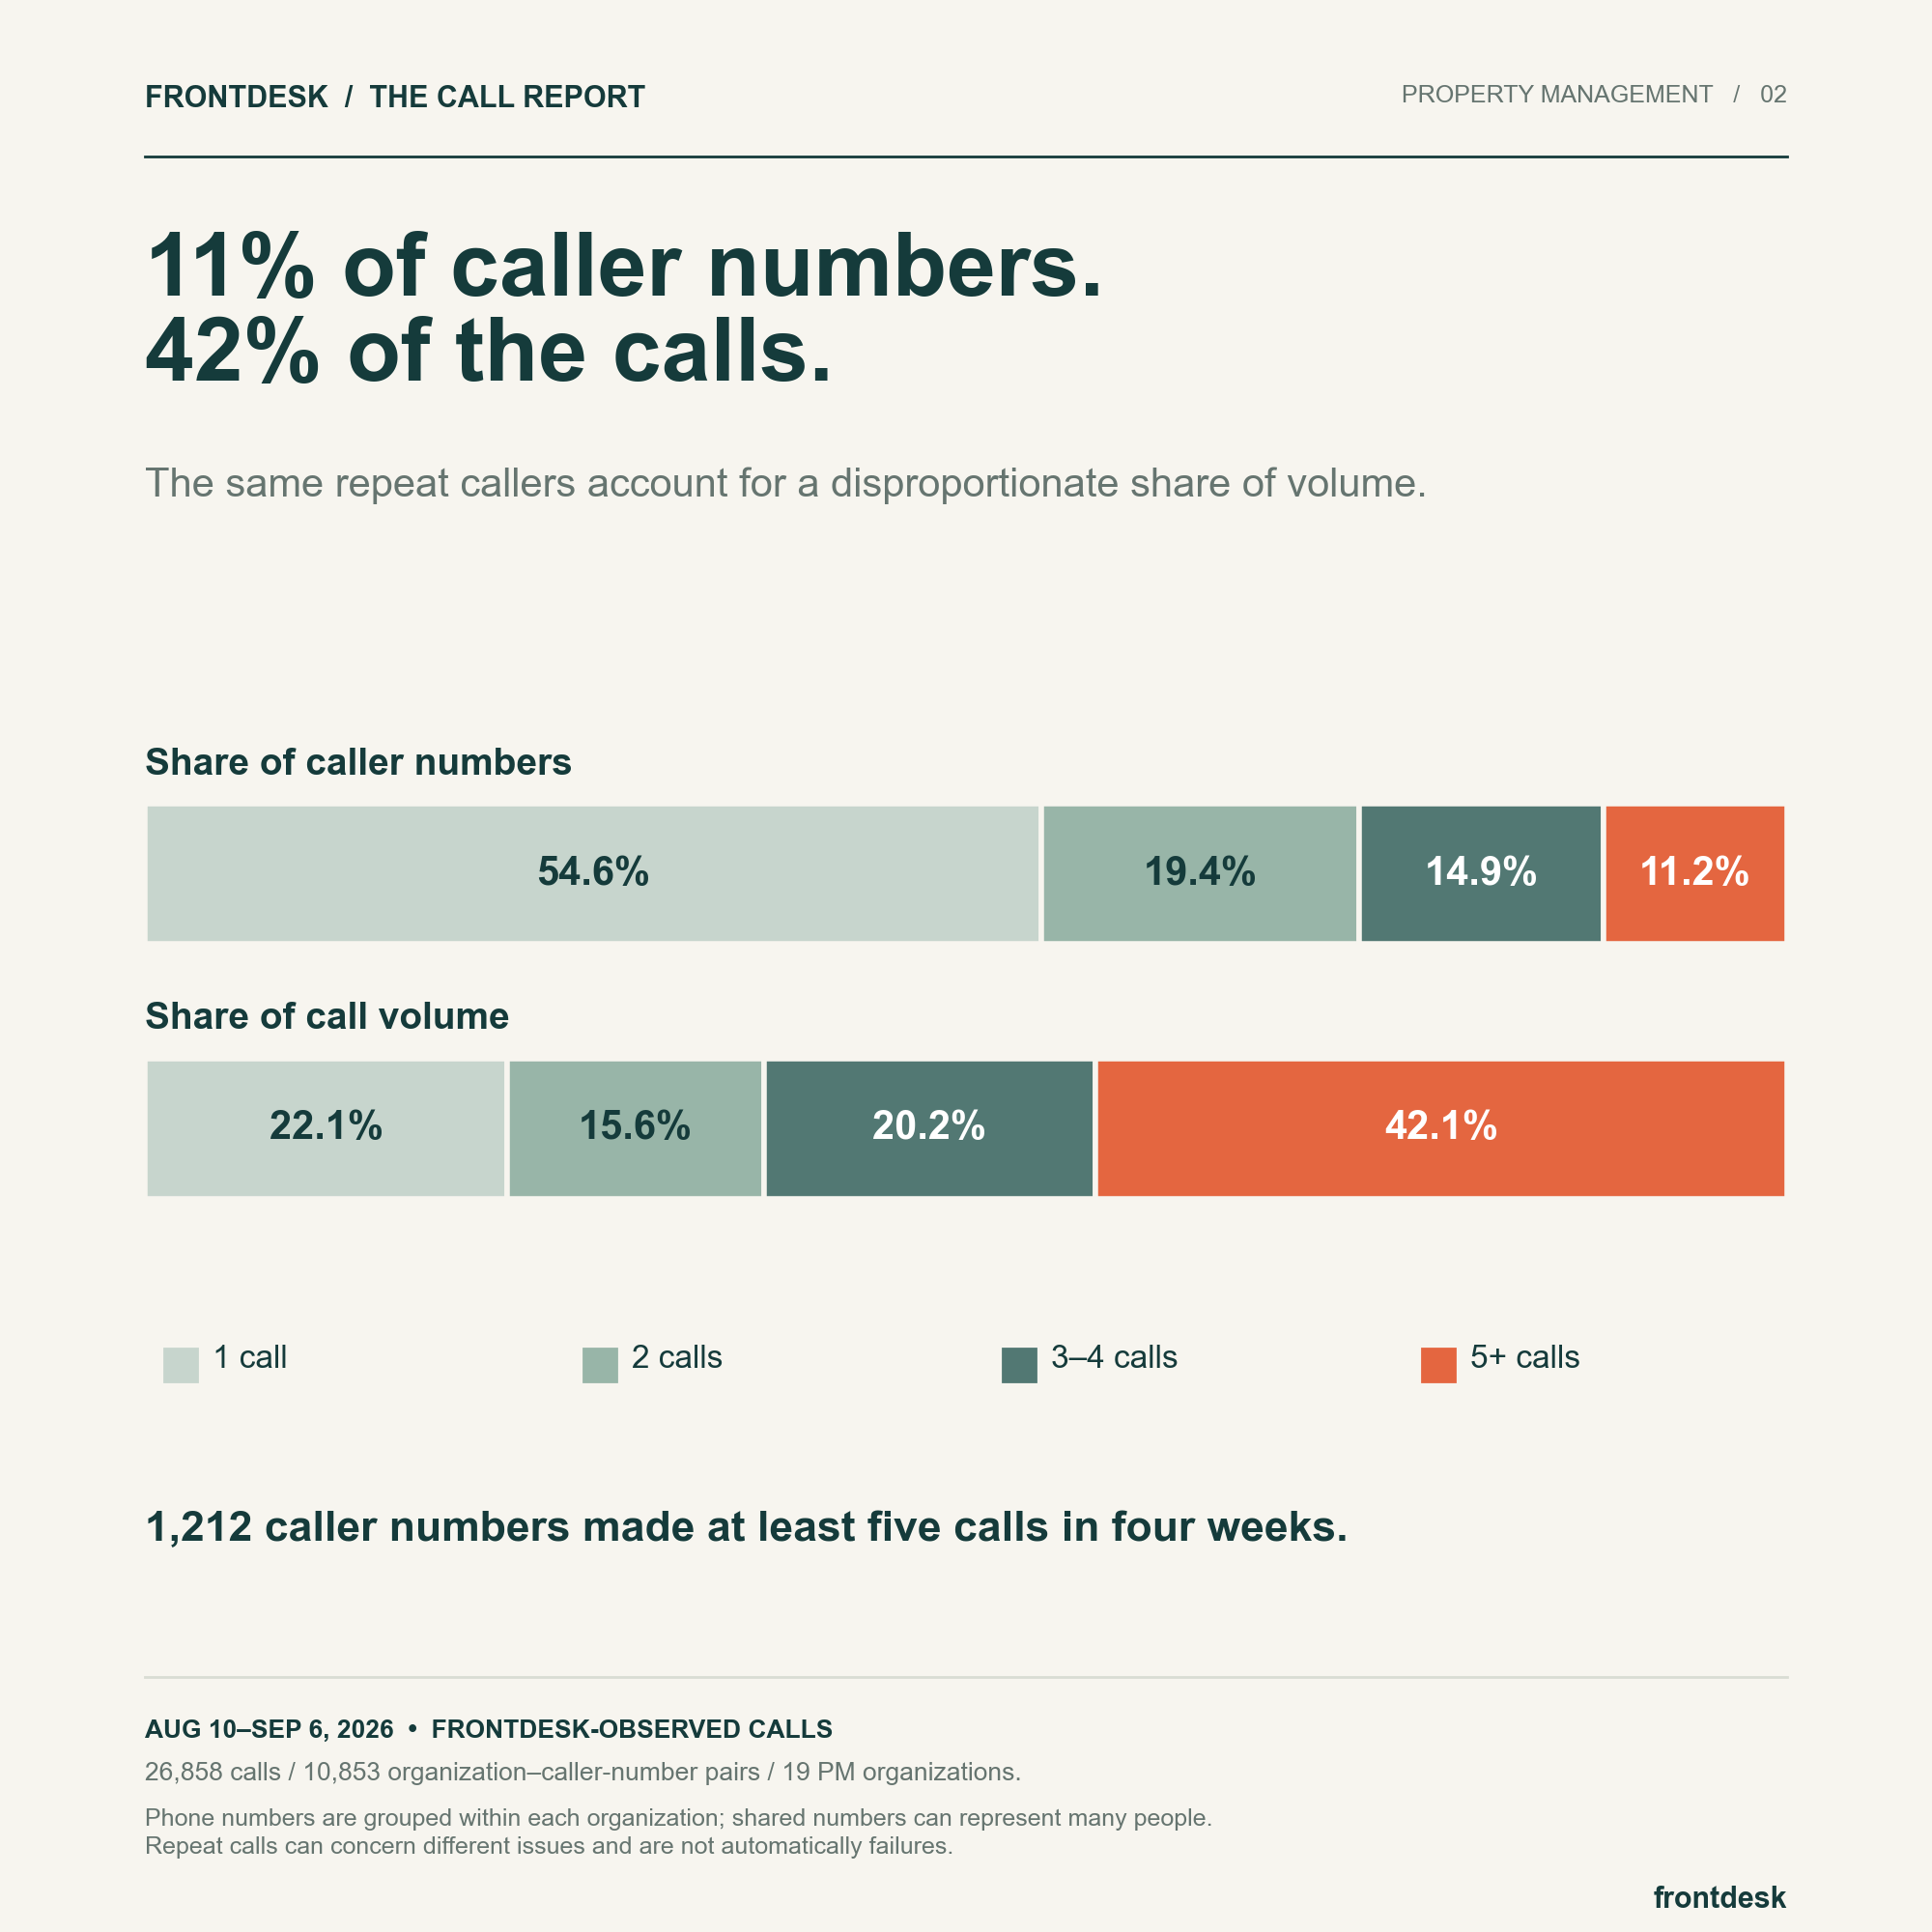
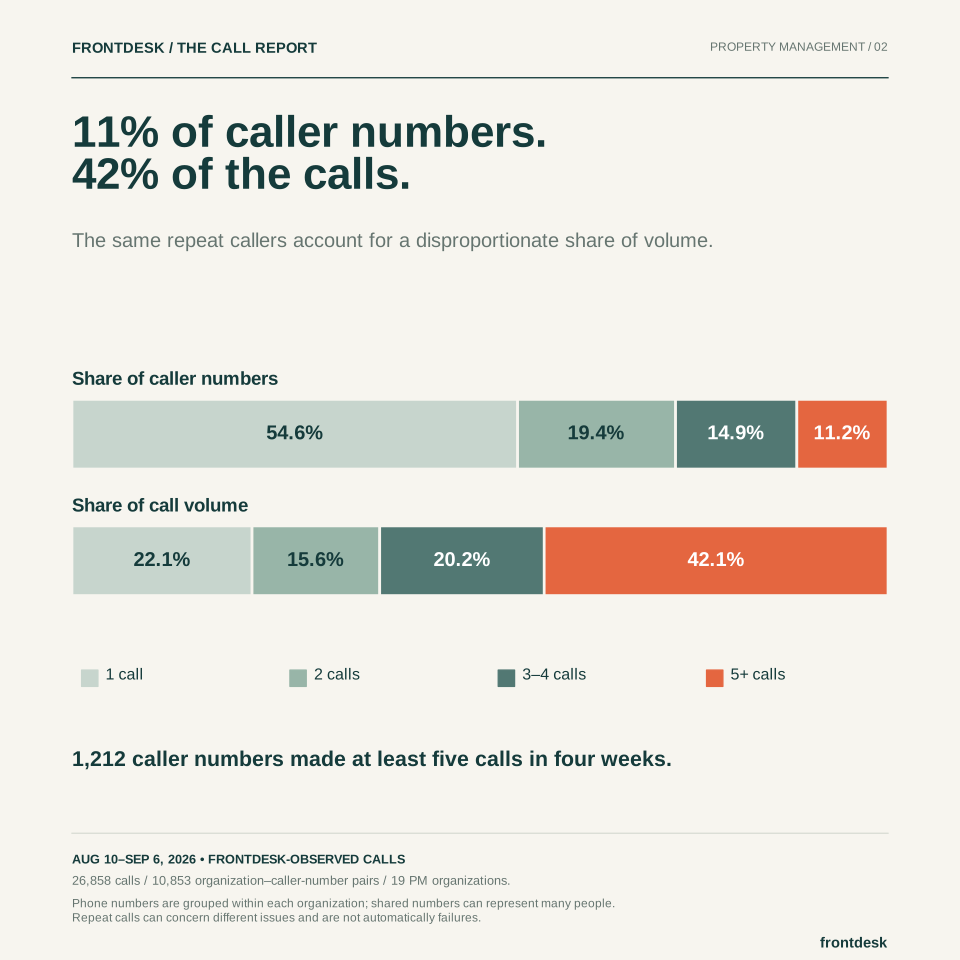
We grouped 26,858 property-management calls with valid caller numbers by organization and phone number. Of the resulting 10,853 pairs, 1,212 called five or more times during the four-week window. Those pairs were 11.2% of the total but generated 11,315 calls: 42.1% of the traffic.
At the other end, 5,927 pairs called once. They represented 54.6% of caller pairs and 22.1% of calls. This is the operational difference between counting a queue and understanding who repeatedly comes back to it. A call-by-call dashboard gives both groups one record at a time; a relationship view makes their very different patterns visible.
Repeat contact is a workflow question
Frequent contact could mean a resident following up on a repair, a vendor coordinating access, a leasing prospect asking several questions, or a staff member using the line. It could also involve unrelated issues. The aggregate does not identify the reason, and five calls is not automatically evidence of poor service.
What it does suggest is a useful review strategy: examine the high-frequency group as a group. Does the conversation history travel with the caller? Can the person or agent answering see the current status of the issue? Is there an obvious owner for the next step? These are more specific questions than asking whether the average call was handled well.
A number is not necessarily one resident
The grouping key is an organization-number pair. The same number calling two organizations is counted separately, and a shared household or office line can represent more than one person. We excluded calls without a valid caller number from this calculation rather than treating them as one anonymous repeat caller.
The largest organization materially affects the magnitude: removing it reduces the five-plus-call group’s share of calls from 42.1% to 34.8%. That is still a substantial concentration, but it is a reason to report both the pooled pattern and the dependence on the underlying business mix.
Make repeat-contact reviews more useful
Use the result to choose a diagnostic sample, then examine actual issue histories. It is a starting point for investigation, not a target for reducing legitimate customer contact.
- Group repeat calls by caller and organization before estimating how many distinct issues they represent.
- Review the most frequent callers for missing status visibility or repeated information collection.
- Pair contact frequency with resolution and satisfaction so needed follow-up is not treated as waste.
The underlying numbers
| Calls per number | Caller pairs | Share of pairs | Calls | Share of calls |
|---|---|---|---|---|
| 1 | 5,927 | 54.6% | 5,927 | 22.1% |
| 2 | 2,101 | 19.4% | 4,202 | 15.6% |
| 3–4 | 1,613 | 14.9% | 5,414 | 20.2% |
| 5+ | 1,212 | 11.2% | 11,315 | 42.1% |
About this analysis
Methodology & limitations
- Eligible property-management calls with valid caller numbers: 26,858 across 19 organizations. Calls were grouped within the observation window by organization and phone number.
- Frequency buckets describe observed calls in this window only. They do not estimate lifetime contact frequency, unique residents, or unresolved issues.
All figures describe the fixed August 10–September 6, 2026 observation window. The sample is drawn from Frontdesk customers and is not representative of every business or property manager. These findings are descriptive; they do not establish cause and effect.
Read the full methodology, sample exclusions, and sensitivity checks ↗
Use this research
You can share the chart with attribution to Frontdesk Insights and a link to this article. Keep its source, date range, and sample notes with the image.