
Property management · Original research
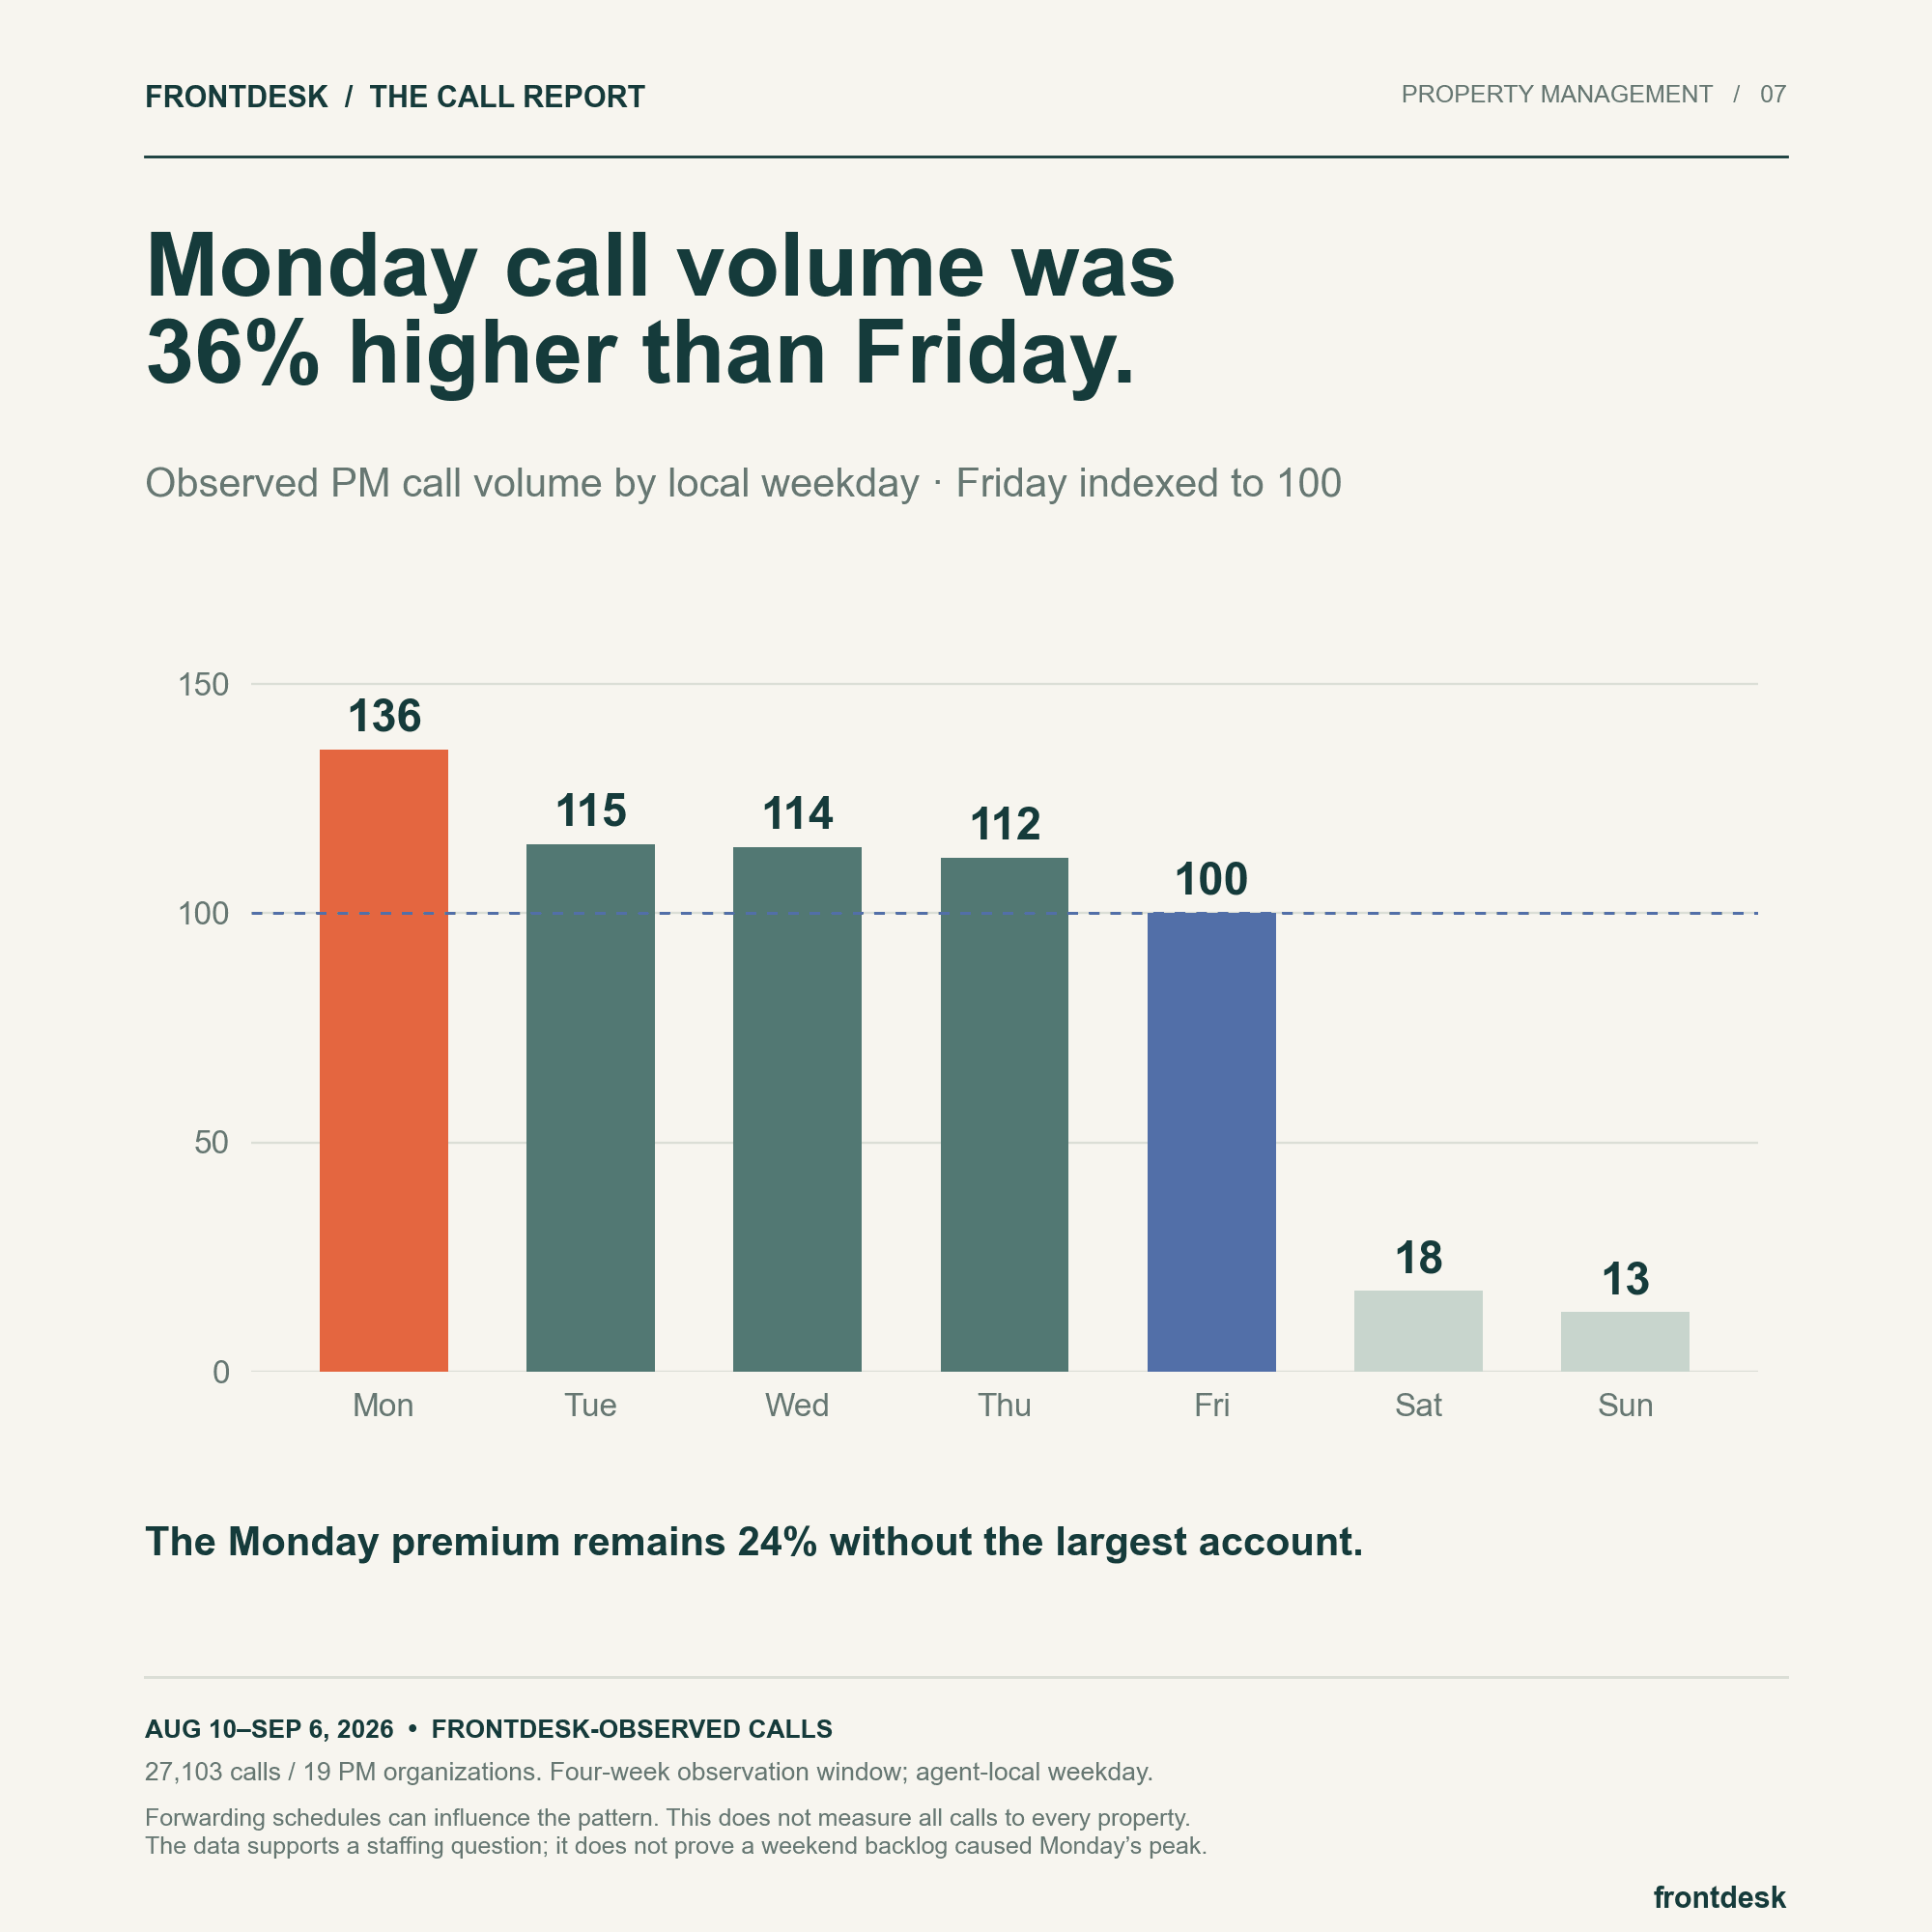
Monday call volume was 36% higher than Friday.
The workweek was uneven in this property-management sample, with Monday generating the most calls.
The average weekday is not the busiest weekday
Over the four-week observation window, the property-management sample recorded 6,052 Monday calls and 4,462 Friday calls. Monday volume was 35.6% higher. Tuesday, Wednesday, and Thursday fell between those endpoints, with 5,129, 5,100, and 4,995 calls respectively.
The chart indexes Friday at 100 to make the relative load easy to see. Monday reaches 135.6; the middle weekdays are roughly 112 to 115. These are calls reaching the observed AI lines, not a full inventory of every phone call received by each business.
Capacity planning needs the shape of the week
A staffing or escalation plan built around a weekly mean can miss a recurring concentration. Even when an AI system answers the initial call, the next step may depend on a leasing consultant, maintenance coordinator, or office team. The day those follow-up tasks arrive can matter as much as the total weekly number.
The data does not prove that a weekend backlog caused the Monday peak. Advertising schedules, payment cycles, office routines, forwarding settings, and the mix of callers could all affect the distribution. Describing the pattern is useful; assigning a cause requires additional evidence.
A pooled pattern, with a meaningful sensitivity
Removing the largest property-management organization reduces Monday’s premium over Friday from 35.6% to 23.9%. Monday still leads, but the size of the gap depends on the operators included. An individual portfolio could have a different weekly shape.
Weekdays are assigned using each agent’s configured local time zone. The extraction itself is a fixed 28-day UTC window, so local dates at the edges contain partial adjacent days. This is a weekday allocation over that fixed exposure, not a claim that every local calendar date was observed as a complete day.
Plan for the follow-up queue as well as the phone
Before shifting staffing, reproduce the chart for your own properties and connect it to the work that follows each call.
- Split weekday volume by leasing, maintenance, billing, and other topics.
- Compare call arrivals with human follow-up completion by day and hour.
- Check whether Monday creates more open work, longer waits, or simply more completed interactions.
The underlying numbers
| Local weekday | Calls | Friday = 100 |
|---|---|---|
| Monday | 6,052 | 135.6 |
| Tuesday | 5,129 | 114.9 |
| Wednesday | 5,100 | 114.3 |
| Thursday | 4,995 | 111.9 |
| Friday | 4,462 | 100.0 |
| Saturday | 786 | 17.6 |
| Sunday | 579 | 13.0 |
About this analysis
Methodology & limitations
- All 27,103 eligible property-management calls are assigned a local weekday using the configured agent time zone.
- Friday is the index baseline: weekday call count divided by 4,462, multiplied by 100.
- The UTC observation window covers 28 days. Time-zone conversion creates partial local dates at its boundaries.
All figures describe the fixed August 10–September 6, 2026 observation window. The sample is drawn from Frontdesk customers and is not representative of every business or property manager. These findings are descriptive; they do not establish cause and effect.
Read the full methodology, sample exclusions, and sensitivity checks ↗
Use this research
You can share the chart with attribution to Frontdesk Insights and a link to this article. Keep its source, date range, and sample notes with the image.