
Property management · Original research
Tour conversations don’t fit neatly into 9–5.
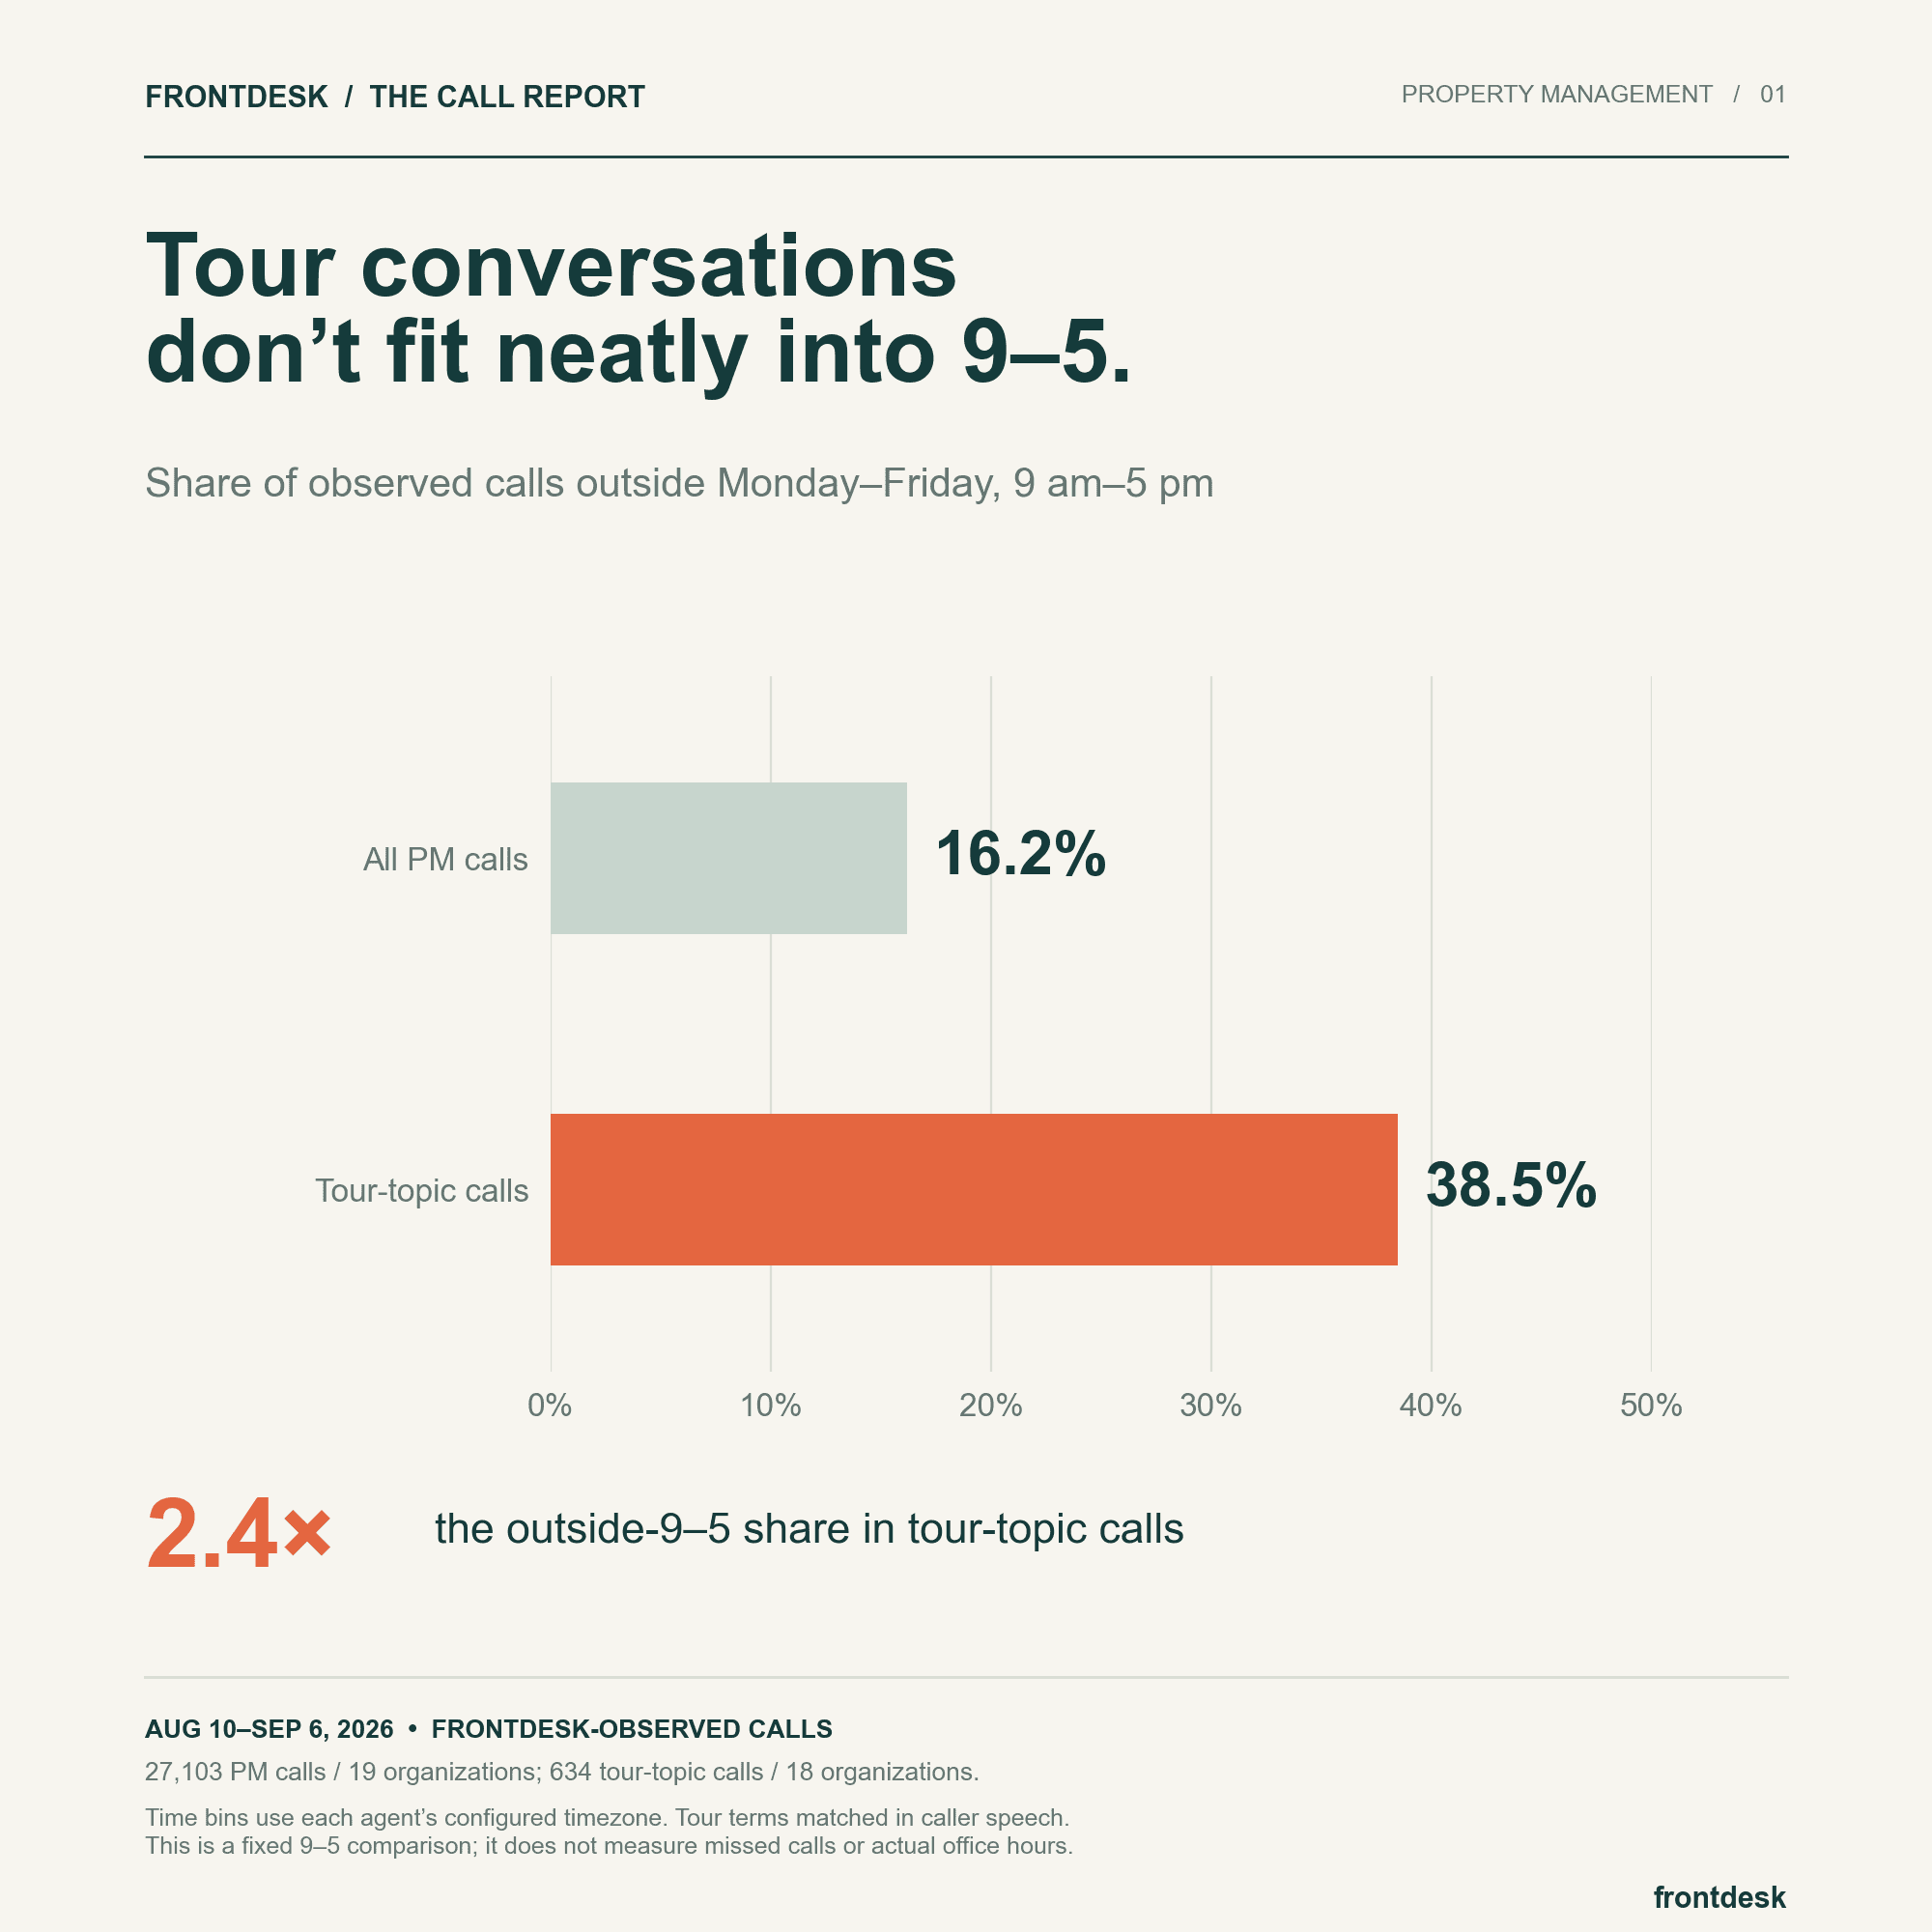
Tour-related calls were 2.4 times as likely as the overall property-management call mix to arrive outside weekday reference hours.
The leasing slice has a different clock
Across 27,103 calls to 19 property-management organizations, 4,390 arrived outside 9 a.m. to 5 p.m. Monday through Friday in the configured local time zone. That is 16.2% of the overall sample. Looking only at calls where callers mentioned a tour, viewing, or showing changes the picture: 244 of 634 calls, or 38.5%, fell outside those hours.
The difference is 22.3 percentage points. Put another way, the outside-hours share was about 2.4 times as high in tour-topic calls. These calls can concern an upcoming tour, a reschedule, directions, or a new showing inquiry. The result describes when tour conversations reached the AI line; it does not measure unbooked tours or missed prospects.
Why total volume can mislead staffing decisions
An operator looking only at the full call mix could reasonably prioritize weekday daytime coverage. But a smaller category can have a very different timing profile. Maintenance, billing, vendor, and general-office calls can dominate the overall pattern while leasing conversations have different needs.
That distinction matters when deciding what after-hours coverage should actually do. A general message-taking workflow and a workflow that can answer availability questions, collect a preferred tour time, or route a reschedule solve different problems. The data suggests separating those workflows when evaluating coverage; it does not establish which one will produce more leases.
The pattern survives removing the largest operator
One organization supplied 40.2% of the property-management records, so a pooled average deserves a concentration check. Removing it leaves an outside-hours share of 39.5% for tour-topic calls. The direction of the result remains, although this is still a selected sample of businesses using Frontdesk.
The 9–5 definition is a common reference schedule, not a claim about any property’s posted office hours. A Saturday showing call is outside this reference even if a leasing office is open that day. Forwarding rules also determine which calls reach the AI line, so this is not a census of every call to every property.
What to measure in your own portfolio
The useful next step is to connect timing to a verified next step. Start with the same view by property and intent, then layer in actual office hours and tour outcomes.
- Compare tour-topic volume inside and outside each property’s real staffed hours.
- Separate a new showing inquiry from a reschedule, cancellation, or directions request.
- Track confirmed bookings and attended tours before attributing revenue to expanded coverage.
The underlying numbers
| Call group | All calls | Outside reference hours | Share |
|---|---|---|---|
| All property-management calls | 27,103 | 4,390 | 16.2% |
| Tour-topic calls | 634 | 244 | 38.5% |
About this analysis
Methodology & limitations
- The comparison group includes all 27,103 eligible property-management calls. The tour-topic subset contains 634 calls across 18 organizations.
- Tour topics are dictionary matches in recorded caller speech. They are not verified booking requests. Local time uses the agent’s configured time zone at extraction.
- Outside hours means before 09:00 or at/after 17:00 on weekdays, plus all Saturday and Sunday hours.
All figures describe the fixed August 10–September 6, 2026 observation window. The sample is drawn from Frontdesk customers and is not representative of every business or property manager. These findings are descriptive; they do not establish cause and effect.
Read the full methodology, sample exclusions, and sensitivity checks ↗
Use this research
You can share the chart with attribution to Frontdesk Insights and a link to this article. Keep its source, date range, and sample notes with the image.