AI-powered dashboards are transforming how businesses use data. Here's what you need to know:
- Real-Time Data: Unlike older tools, these dashboards connect directly to live data streams, ensuring up-to-date insights.
- Automation: AI handles tasks like cleaning data and writing queries, cutting preparation time by 50–70%.
- Anomaly Detection: AI monitors data continuously, identifying unusual changes and notifying you immediately.
- Predictive Insights: By analyzing trends, these dashboards forecast sales, customer churn, and more.
- Ease of Use: With natural language processing (NLP), anyone can ask questions in plain English and get instant answers.
- Role-Based Personalization: Dashboards tailor content to user roles, showing relevant metrics for each team.
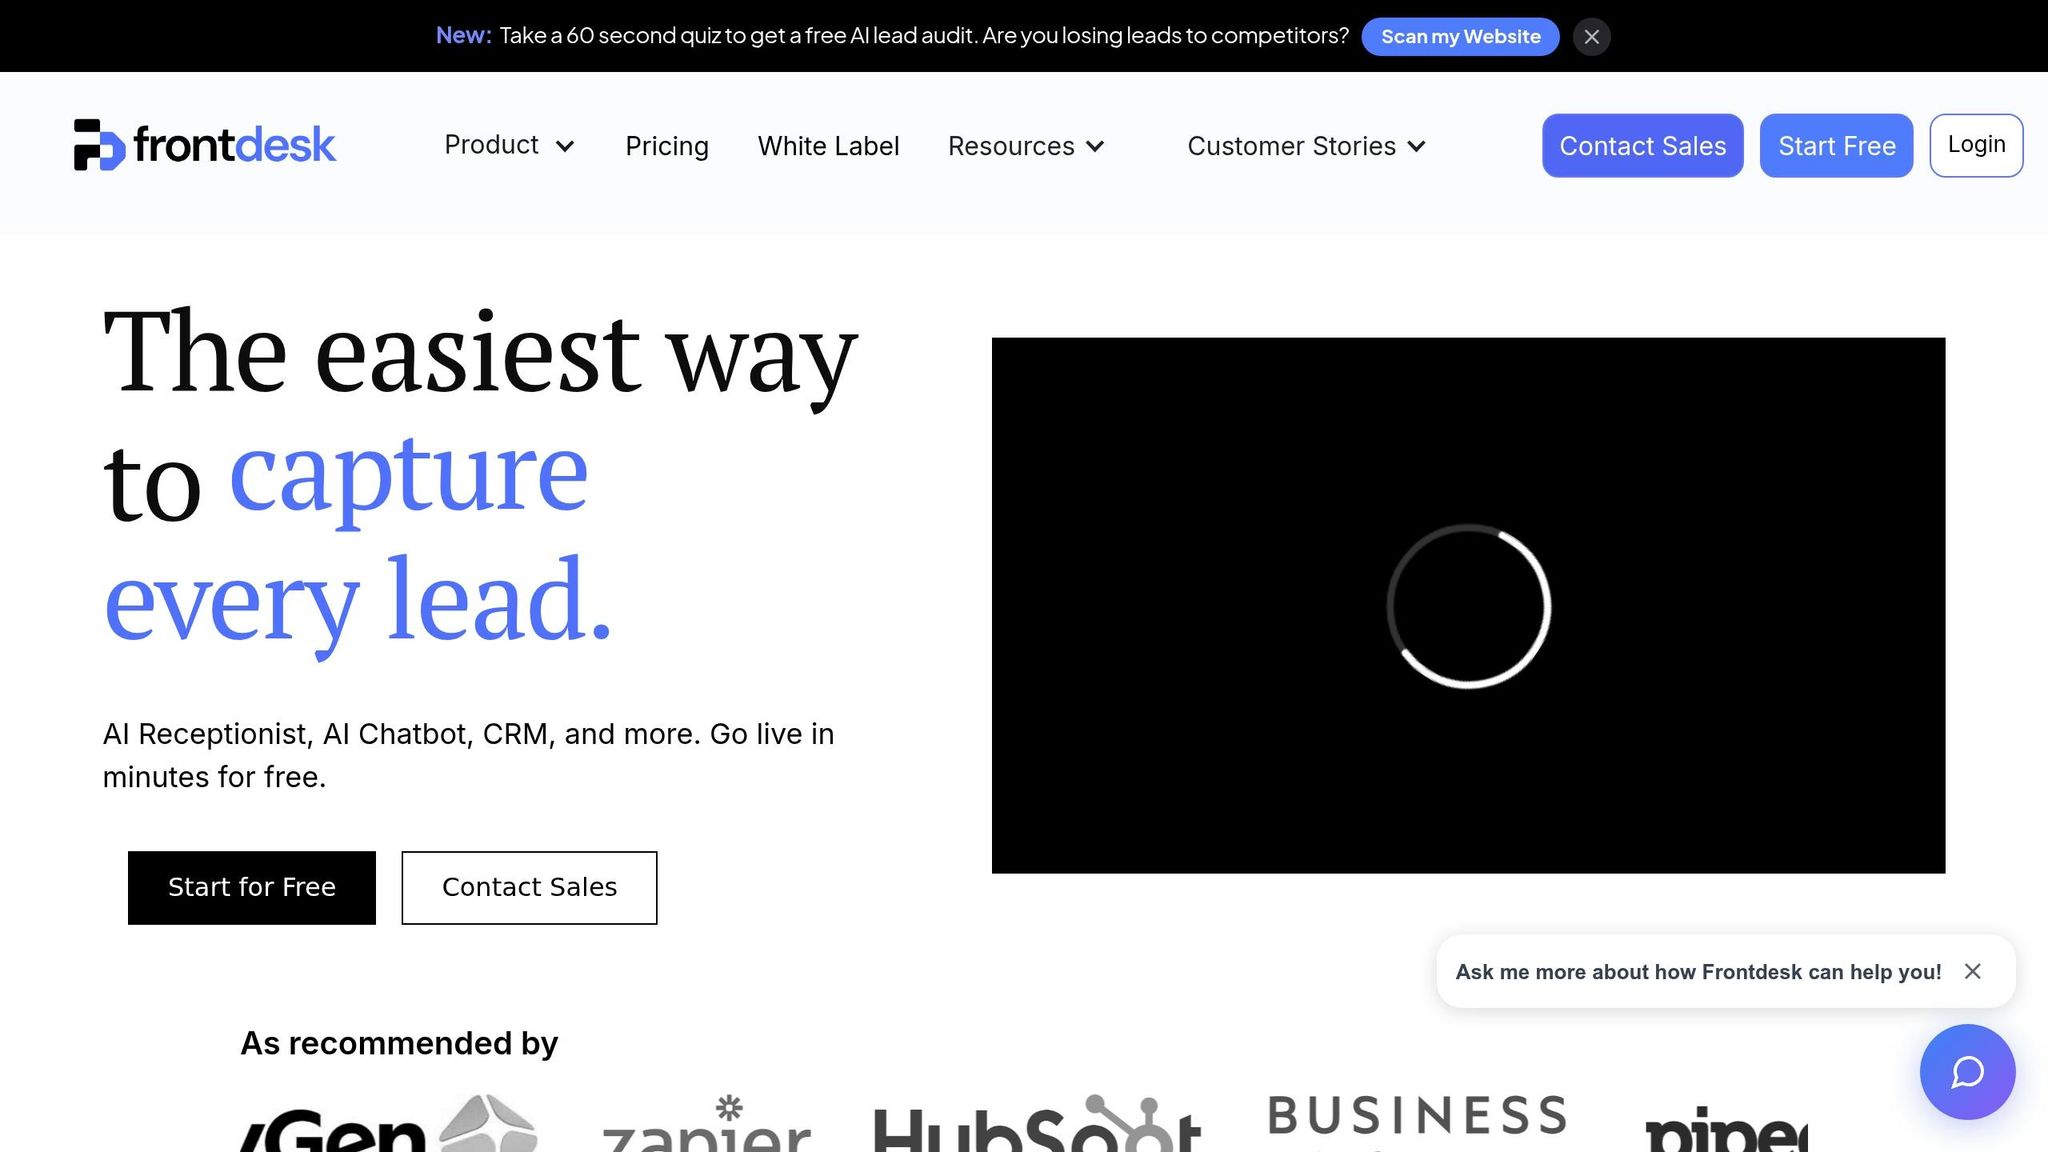
AI dashboards make data accessible, actionable, and easier to use for businesses of all sizes. Small businesses, in particular, benefit from affordable tools like My AI Front Desk, which starts at $65/month. These tools integrate with CRMs, analyze conversations, and provide instant insights - no technical expertise required.
AI is no longer optional; it’s becoming essential for smarter, faster decision-making.
Google's New AI Creates Dashboards at INSANE Speeds#
sbb-itb-e4bb65c
Key Features of AI-Powered Live Data Dashboards#
AI upgrades live dashboards from simple data displays to dynamic tools that actively manage complex tasks for you. The standout features - automated data handling, intelligent monitoring, and predictive capabilities - are designed to tackle common challenges small businesses face, like spending hours on spreadsheets or missing critical red flags. Together, these features improve how businesses make decisions and streamline their operations.
Real-Time Data Processing and Automation#
Traditional dashboards often require tedious manual work - cleaning data, writing SQL queries, and fixing inconsistencies. These steps typically eat up 70% of analytics project time. AI changes the game by automating these processes. It connects directly to tools like CRMs, marketing platforms, and accounting software, pulling in live data streams instead of relying on overnight updates.
Imagine this: a potential customer calls your business, and AI instantly analyzes the conversation to categorize the lead - marking it as a high-priority prospect or flagging it for follow-up. Your dashboard updates in real time. Plus, with Natural Language Processing (NLP), even non-technical team members can ask questions like, "What product sold the most last week?" and instantly view visualizations - no coding required.
Anomaly Detection and Alerts#
AI doesn’t just process your data; it actively monitors it to catch unusual changes. It scans thousands of data points at once to identify deviations from normal patterns. Unlike traditional dashboards that only display numbers, AI highlights what’s important - like a sudden revenue dip or a spike in customer complaints - and explains the reasons behind these anomalies.
This proactive monitoring means you get instant alerts instead of waiting for monthly reviews. For example, if your call volume drops by 30% on a Tuesday afternoon, AI can notify you immediately and identify the cause, such as a website issue or phone system outage. This real-time visibility into key performance indicators (KPIs) can help businesses reduce financial risks by up to 25%.
Predictive Analytics and Insights#
AI-powered dashboards go beyond real-time updates and alerts - they also predict future trends and challenges. By analyzing historical data alongside current trends, these dashboards can forecast sales, estimate customer churn risks, and model "what-if" scenarios. For example, you can see how increasing your marketing budget by 20% might affect cash flow next quarter.
Predictive maintenance models using AI often achieve 85–95% accuracy in forecasting failures. In one case, a financial services company reduced customer attrition by 22% in 2024 by linking customer interactions to churn risk. For small businesses, this means identifying at-risk customers before they leave, giving you time to take action. AI can also rank leads based on engagement history, ensuring your sales team focuses on the most promising prospects.
Natural Language Queries: Making Dashboards Easier to Use#
The biggest hurdle with dashboards isn’t the data - it’s the technical know-how needed to access it. AI changes the game by allowing users to ask questions in plain English instead of relying on SQL queries or building complicated reports. With Natural Language Querying (NLQ), questions like "Which region had the fastest profit growth?" are turned into actionable queries automatically. No database expertise required.
This shift is reshaping how teams use data. Companies that adopt NLP-powered dashboards report a jump in data usage - from just 30% of employees with traditional tools to 75%–80% actively engaging with data for insights. Philip Basaric, Product Manager for Data Products at Whip Media, shared:
"The use of Dashboards for internal reporting has increased overall organizational transparency and enabled non-data teams to make data-informed decisions".
You can also refine your queries on the go. After an initial question, follow up with commands like "filter by the Northeast region" or "switch to a line graph". The AI even suggests the best visualization type - whether it’s a chart, table, or graph - based on your query. Taking it further, Natural Language Generation (NLG) provides written explanations that clarify the "why" behind trends, not just the raw numbers. This kind of interaction bridges technical gaps and makes dashboards far more intuitive.
Personalization Based on User Roles#
AI dashboards don’t just simplify language - they personalize the experience for each user. They tailor content based on roles, so a sales manager might see pipeline updates and lead conversion rates, while a finance director views budget metrics and cash flow projections. This is achieved through role-based access controls (RBAC), which ensure users only see insights relevant to their role.
A semantic layer underpins this personalization, aligning business terms with technical data. For example, if different team members ask about "Total Revenue", the AI ensures they all receive the same standardized definition, avoiding confusion and guaranteeing accurate insights - all without IT needing to step in.
Improved Accessibility for Small Businesses#
AI-powered dashboards are especially helpful for small businesses. Without the budget for dedicated analysts or technical teams, these tools make data accessible to everyone. Since coding expertise isn’t required, there’s no need to hire specialists or spend weeks training staff. Team members can start asking questions and getting answers right away - making these dashboards as practical as they are powerful.
My AI Front Desk: AI-Powered Analytics Dashboard#
Small businesses often struggle to manage scattered data from calls, texts, and chats. The My AI Front Desk Analytics Dashboard simplifies this by transforming raw conversational data into actionable insights, all within one interface. Using tools like GPT-4, Claude, and Grok, it analyzes each interaction and categorizes it by intent - whether it's a "new lead", "appointment booking", or "customer support". This tool brings together communication analytics and CRM integration for lead qualification to streamline data management.
Call Insights and CRM Integration#
The dashboard provides real-time metrics, including call volume, missed-to-answered call ratios, peak inquiry times, and lead capture rates , helping businesses generate more sales leads. Its Autopilot CRM feature goes a step further by automatically organizing leads into custom categories like "Hot Leads" or "Follow-up Required" based on live conversation analysis. Users can view this data through Kanban boards, detailed lists, or individual profiles that include complete interaction histories.
Integration options are robust, with access to over 9,000 applications via Zapier. It also connects directly to Google Calendar, various CRMs, and even Electronic Health Records (EHR) systems for healthcare providers.
Real-Time Anomaly Detection in Communication Metrics#
The dashboard’s AI continuously tracks communication metrics to identify unusual patterns. For example, it flags issues like sudden spikes in missed calls or drops in booking rates as they happen. The activity log helps businesses pinpoint peak call times to optimize staffing, filter leads by marketing source to assess ROI, and analyze conversation trends to uncover potential revenue streams.
Customization and Multi-Language Support#
Personalization is a key feature of the dashboard. It tailors views based on user roles, ensuring executives see high-level metrics while frontline staff access operational details. The Intelligent Group Builder uses plain-English criteria to sort leads automatically.
Additionally, the platform supports multiple languages, with GPT-4 and Claude processing multilingual conversations and presenting the data in a unified format. Natural Language Generation (NLG) further simplifies complex datasets into clear, easy-to-read reports, making insights accessible even to non-technical users.
With pricing starting at $65 per month - complete with 200+ free AI receptionist minutes - this solution is designed to be both powerful and accessible for businesses of all sizes.
Standard Dashboards vs. AI-Powered Dashboards#
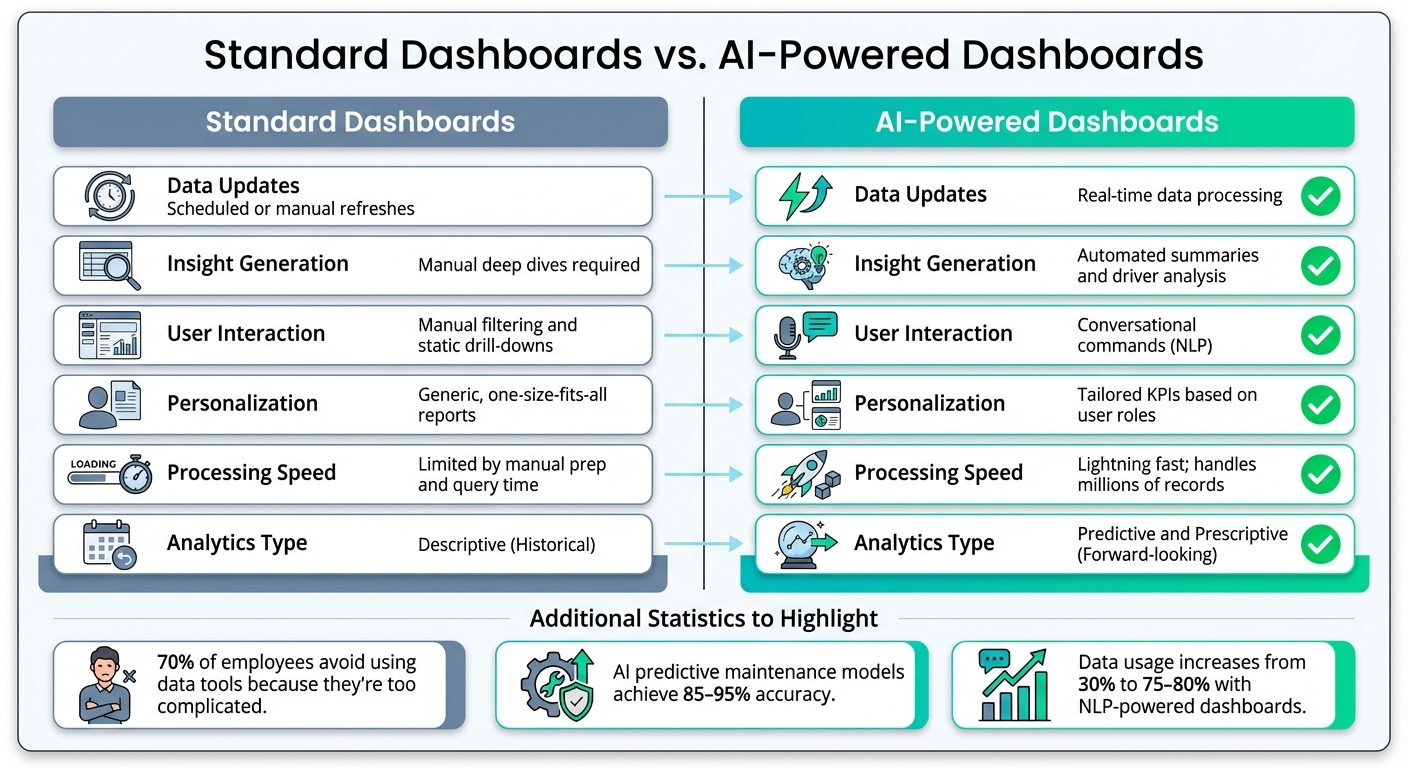
Standard vs AI-Powered Dashboards: Key Feature Comparison
Traditional dashboards have long been the go-to tool for visualizing data, but they come with limitations. They depend on scheduled updates, which means the data you see could already be hours or even days old. Extracting insights often requires manually sifting through layers of data, making it a time-consuming process.
AI-powered dashboards take a completely different approach. They process data in real time, identify patterns across thousands of data points, and deliver actionable insights without requiring you to dig through endless reports. This makes them a game-changer for businesses that need fast, data-driven decisions.
Another key difference is accessibility. Standard dashboards often require technical expertise - knowing SQL or relying on an analyst to create custom reports. In contrast, AI dashboards are designed for simplicity. You can ask questions in plain English, like "Which region had the fastest profit growth this quarter?" and instantly get visual answers. This ease of use is critical when you consider that nearly 70% of employees avoid using data tools because they find them too complicated.
These differences highlight why AI-powered dashboards are reshaping business analytics.
Feature Comparison Table#
| Feature | Standard Dashboards | AI-Powered Dashboards |
|---|---|---|
| Data Updates | Scheduled or manual refreshes | Real-time data processing |
| Insight Generation | Manual deep dives required | Automated summaries and driver analysis |
| User Interaction | Manual filtering and static drill-downs | Conversational commands (NLP) |
| Personalization | Generic, one-size-fits-all reports | Tailored KPIs based on user roles |
| Processing Speed | Limited by manual prep and query time | Lightning fast; handles millions of records |
| Analytics Type | Descriptive (Historical) | Predictive and Prescriptive (Forward-looking) |
The advantages of AI go beyond speed and convenience. For example, predictive maintenance models powered by AI can achieve 85–95% accuracy in detecting potential failures. These immediate insights not only streamline workflows but also empower businesses to make strategic decisions in real time.
Conclusion: AI and the Future of Live Data Dashboards#
AI is changing how businesses interact with their data. Gone are the days of waiting for lengthy reports or manually sorting through information. Now, companies can tap into real-time insights that drive immediate decisions. The evolution from descriptive analytics ("what happened") to predictive and prescriptive analytics ("what will happen" and "what should we do") represents a major leap forward in business intelligence.
By streamlining workflows, AI dramatically reduces operational costs and slashes the time needed to gather insights. In fact, by 2025, it's estimated that over 80% of large organizations will rely on BI dashboards to monitor KPIs in real time. As Ruby Williams aptly states:
"AI is no longer a nice-to-have; it's a prerequisite for data-informed decision-making".
For small businesses, the impact is even more striking. Platforms like My AI Front Desk are leveling the playing field by offering affordable, AI-powered analytics tools. For just $65/month, businesses can access dashboards that turn conversational data - like phone calls, SMS, and web chats - into actionable sales leads. These tools track key metrics such as peak inquiry times and lead conversion rates, optimizing lead generation, categorize customer interactions automatically, and integrate seamlessly with over 9,000 apps via Zapier.
But the changes go beyond individual tools. The future of live data dashboards is about more than just faster updates or polished visuals. It's about making data accessible to everyone. With AI, users can ask questions in plain English and get instant, visual answers - no technical expertise required. This eliminates the need for manual data preparation, freeing up teams to focus on smarter, growth-driven decisions. By empowering every team member to contribute, businesses can align strategic goals with day-to-day operations more effectively.
The move toward AI-powered dashboards is already underway. Those embracing this shift today are positioning themselves as the industry leaders of tomorrow.
FAQs#
What data sources can an AI dashboard connect to?#
An AI dashboard connects seamlessly with multiple data sources like CRMs, marketing analytics tools, accounting software, and live data streams. This integration allows for real-time insights and customized monitoring to align with your specific business requirements.
How does AI reduce errors in messy, inconsistent data?#
AI helps clean up messy, inconsistent data by leveraging advanced tools that can spot patterns, flag anomalies, and standardize formats automatically. These tools work to enhance data quality over time, cutting down on the need for manual fixes and ensuring datasets remain consistent and reliable.
How do AI dashboard alerts avoid false alarms?#
AI dashboard alerts are designed to cut down on false alarms by employing advanced filtering and validation techniques. By leveraging AI, these systems can distinguish between real threats and irrelevant information, reducing false positives by as much as 99.95%. This means businesses can rely on accurate, actionable alerts, allowing them to concentrate on critical issues without being bogged down by unnecessary interruptions.